S&P 500 — US Large Cap Index
 FTSE 100 — UK Blue Chips
 Euro Stoxx 50 — Eurozone Leaders
 DAX 40 — German Equities
 CAC 40 — French Market Index
 Nikkei 225 — Japan Benchmark
 Hang Seng — Hong Kong Index
 Shanghai Composite — China Mainland
 ASX 200 — Australian Market
 TSX Composite — Canada Index
 Nifty 50 — India Large Cap
 STI Index — Singapore Market
 KOSPI — South Korea Index
 Bovespa — Brazil Equities
 JSE Top 40 — South Africa Index
 IPC Index — Mexico Market
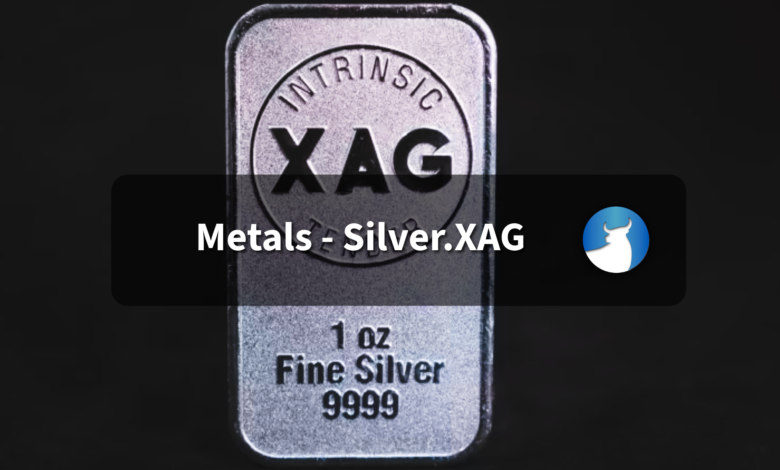
- Silver struggles as stronger US jobs data boosted expectations of an imminent September Federal Reserve interest rate hike.
- Nonfarm payrolls surged by 162,000, while unemployment held steady at 4.1% and wage growth slowed moderately.
- Escalating US-Iran geopolitical tension near the Strait of Hormuz drove up oil prices, reigniting inflation concerns.
Silver price (XAG/USD) inches higher after opening at a bearish gap, remaining in negative territory and trading around $66.10 per troy ounce during Asian hours on Monday. Silver prices remain under pressure as stronger-than-expected United States (US) employment data fuels expectations of an imminent Federal Reserve interest rate hike.
According to the US Bureau of Labor Statistics, August Nonfarm Payrolls rose by 162,000, significantly outperforming the 56,000 forecast. Meanwhile, the unemployment rate held steady at 4.1%, and annual wage growth slowed less than anticipated to 3.1%. Following these figures, traders rapidly priced in tighter monetary policy, with the CME FedWatch tool indicating a 58.3% probability of a 25-basis-point Fed rate increase in September.
Hammack flags need for more Fed tightening as inflation stays too high
Fed’s Hammack delivered a notably more hawkish message, with a 9.2/10 FXS Speechtracker score standing well above the 7.6/10 historical average, signaling a clear shift toward tighter policy rhetoric. The assertion that Fed policy is “not restrictive” and that inflation is “too high,” combined with local contacts indicating “now is time for Fed to hike,” underscores a bias toward additional rate increases and challenges any market expectation of an imminent pivot. This tone supports a stronger Dollar narrative as markets reprice the path of policy toward further tightening.
The FXS Fed Sentiment Index rose by 1.14 points to 125.72, reinforcing that overall Fed communication remains firmly in hawkish territory according to the FXS Speechtracker. With the index well above the neutral 100 mark, the latest move suggests incremental but meaningful reinforcement of higher-for-longer rate expectations, a backdrop typically supportive for the Dollar and a headwind for risk-sensitive currencies.
Adding to Silver’s headwinds, rising crude oil prices have stoked fears of rekindled inflationary pressures following a geopolitical escalation between the US and Iran over the weekend. The conflict intensified after the US targeted three Iranian tankers in response to missile attacks on its warships, leading Tehran to establish a new restricted zone around the Strait of Hormuz.
Technical Analysis:
In the daily chart, XAG/USD trades at $66.10. The near-term tone is neutral as price holds above the longer-term 50-day Exponential Moving Average (EMA) but sits just under the shorter-term nine-day EMA, hinting at consolidation after the recent advance. The 14-day Relative Strength Index (RSI) at 52.70 stays slightly above neutral, suggesting modest positive momentum without entering overbought conditions.
On the topside, immediate resistance emerges at the nine-day EMA around $66.33, and a clear break above this dynamic cap would be needed to revive a stronger bullish extension. On the downside, initial support is seen at the 50-day EMA near $64.91; a daily close below this level would expose a deeper corrective phase, while holding above it would keep the broader constructive structure intact.