S&P 500 — US Large Cap Index
 FTSE 100 — UK Blue Chips
 Euro Stoxx 50 — Eurozone Leaders
 DAX 40 — German Equities
 CAC 40 — French Market Index
 Nikkei 225 — Japan Benchmark
 Hang Seng — Hong Kong Index
 Shanghai Composite — China Mainland
 ASX 200 — Australian Market
 TSX Composite — Canada Index
 Nifty 50 — India Large Cap
 STI Index — Singapore Market
 KOSPI — South Korea Index
 Bovespa — Brazil Equities
 JSE Top 40 — South Africa Index
 IPC Index — Mexico Market
- XRP’s price and on-chain activity have been flat despite tailwinds from the SEC dropping its appeal against Ripple.
- XRP’s rising supply could cause downward pressure on its price if demand fails to pick up.
- XRP risks a further decline to $1.35 if it validates a Head and Shoulders pattern.
Ripple’s XRP is down 7% on Friday following bearish pressure from macroeconomic factors, including United States (US) President Donald Trump’s tariff threats and rising US inflation. The downside pressure could accelerate if XRP’s on-chain activity fails to pick up amid its rising supply.
XRP on-chain metrics stay mum as supply spikes
XRP — like most cryptocurrencies — has been heavily impacted by Trump’s tariff threats in the past weeks, suffering a 35% drawdown from its peak of $3.40 in January. This largely contrasts with its move in the last quarter of 2024 into early January, where it surged over 500%.
The announcement of the US Securities and Exchange Commission (SEC) dropping its appeal against Ripple also failed to trigger an XRP rally, as prices remained flat. Investors had already largely priced in the outcome, considering the new SEC administration ended several legal cases against crypto companies.
It’s unclear whether XRP will see similar moves as it did last quarter again in the current cycle, considering there are no primary tailwinds affecting its price in the coming months and its declining on-chain activity.
Whale investors have scaled down their activity, with their transaction count trending toward pre-US election levels.
%20[22.17.56,%2028%20Mar,%202025]-638787972824872941.png)
XRP whale transaction count. Source: Santiment
Additionally, XRP exchange reserves across Binance and Upbit — which host the largest XRP supply — have been fairly flat since the beginning of March, indicating low accumulation or distribution around the token.
On the derivatives side, XRP’s open interest is gradually recovering, rising to 1.75 billion XRP from a monthly low of 1.35 billion XRP, per Coinglass data.
However, XRP risks declining from supply-side pressure if demand fails to pick up in the coming months. Ripple unlocks 1 billion from its escrow monthly, with an average of 33% of the unlocked supply hitting the market gradually. This is visible in its circulating supply growth in the past year, increasing sharply from 54 billion to 58 billion XRP.
%20Top%205%20Cryptocurrencies-638787974106999959.png)
XRP circulating supply growth
XRP could fall to $1.35 if it validates Head & Shoulders pattern
XRP saw $24.89 million in futures liquidations in the past 24 hours, per Coinglass data. The total amount of long and short liquidations accounted for $23.63 million and $1.26 million, respectively.
The remittance-based token declined below the support near $2.34, recording a 7% loss on the daily timeframe.
XRP could be on the verge of validating a Head-and-Shoulders (H&S) pattern if it breaches the $1.96 support — just below the $2.00 psychological level. Such a move could send XRP toward the $1.35 support level.
On the contrary, XRP could bounce off the $1.96 support as bulls have defended the level on six occasions since its rally above the level last December.
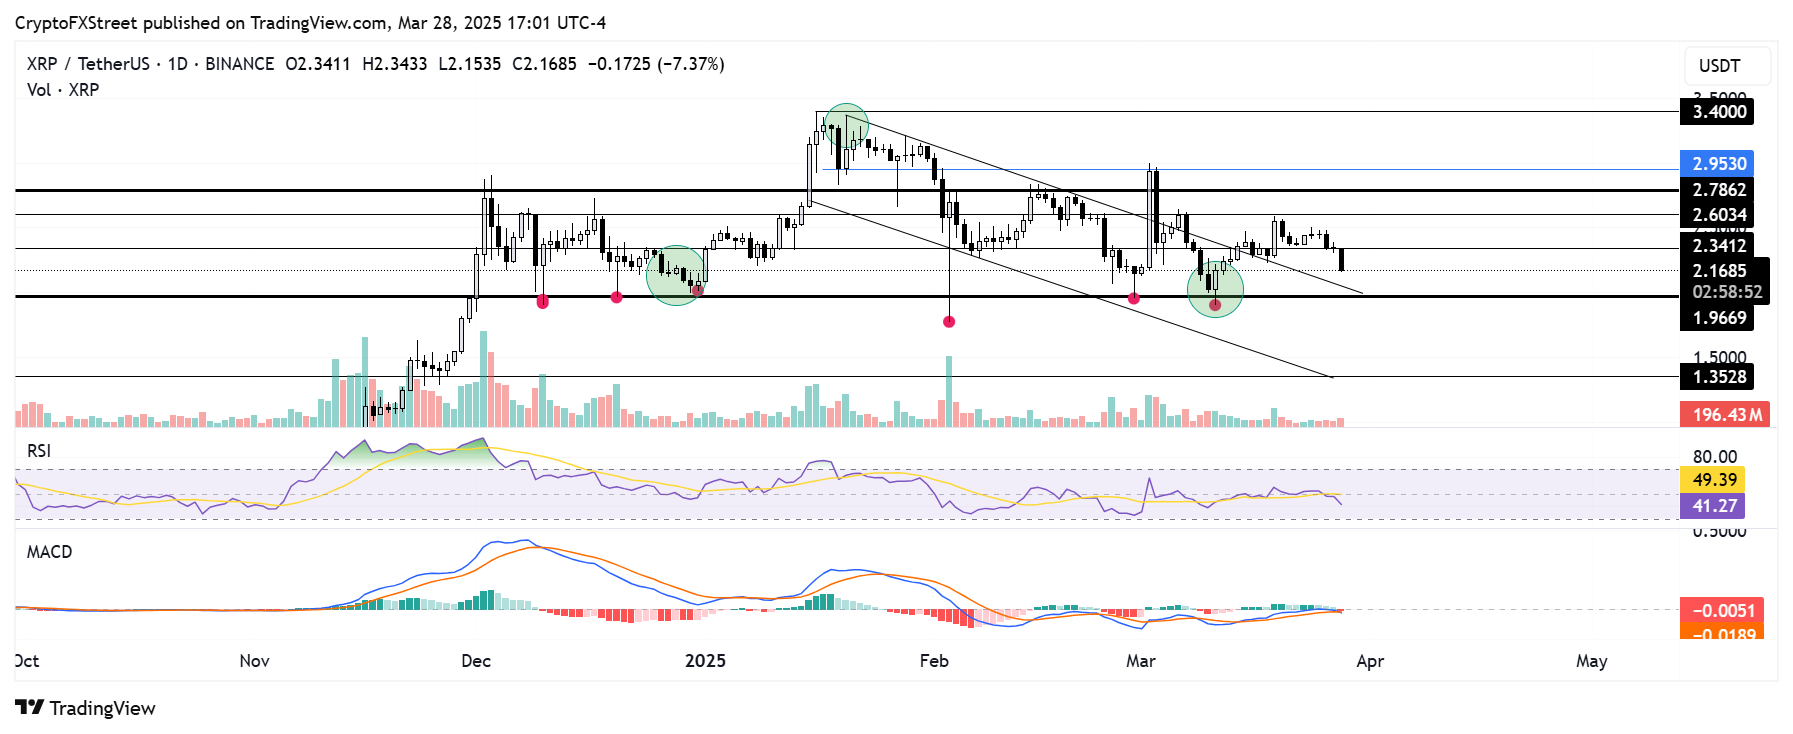
XRP/USDT daily chart
The Relative Strength Index (RSI) and Moving Average Convergence Divergence (MACD) have crossed below their neutral levels and moving averages, indicating rising bearish momentum.
A daily candlestick close above $2.60 will invalidate the thesis and potentially send XRP to test the $2.78 resistance.