S&P 500 — US Large Cap Index
 FTSE 100 — UK Blue Chips
 Euro Stoxx 50 — Eurozone Leaders
 DAX 40 — German Equities
 CAC 40 — French Market Index
 Nikkei 225 — Japan Benchmark
 Hang Seng — Hong Kong Index
 Shanghai Composite — China Mainland
 ASX 200 — Australian Market
 TSX Composite — Canada Index
 Nifty 50 — India Large Cap
 STI Index — Singapore Market
 KOSPI — South Korea Index
 Bovespa — Brazil Equities
 JSE Top 40 — South Africa Index
 IPC Index — Mexico Market
Bitcoin, Ethereum, Ripple – Bulls firmly in control as BTC breaks $93K, ETH and XRP extend gains

- Bitcoin extends its rally above $93,000 on Monday after a decisive breakout from a three-week consolidation range.
- Ethereum continues its gains after bouncing from support at the 50-day EMA.
- XRP prints its fifth consecutive green candlestick, targeting a move toward the $2.35 resistance level.
Bitcoin (BTC), Ethereum (ETH), and Ripple (XRP) extended their rallies on Monday, gaining more than 4%, 6%, and 12%, respectively, in the previous week. The top three cryptocurrencies by market capitalization could continue to outperform, with bulls in control of the momentum.
Bitcoin rallies as it closes above the consolidation zone
Bitcoin’s price closed above the upper consolidation range of $90,000 on Saturday and rose slightly the next day. At the time of writing on Monday, BTC continues its gains, trading above $92,700.
If BTC continues its upward trend, it could extend the rally toward the next resistance at $94,253, which aligns with the 61.8% Fibonacci retracement level drawn from the April low of $74,508 to October’s all-time high of $126,199.
The Relative Strength Index (RSI) on the daily chart reads 62, above the neutral level of 50, indicating bullish momentum is gaining traction. In addition, the Moving Average Convergence Divergence (MACD) indicator showed a bullish crossover and rising green histogram bars above the neutral level, further supporting the bullish outlook.
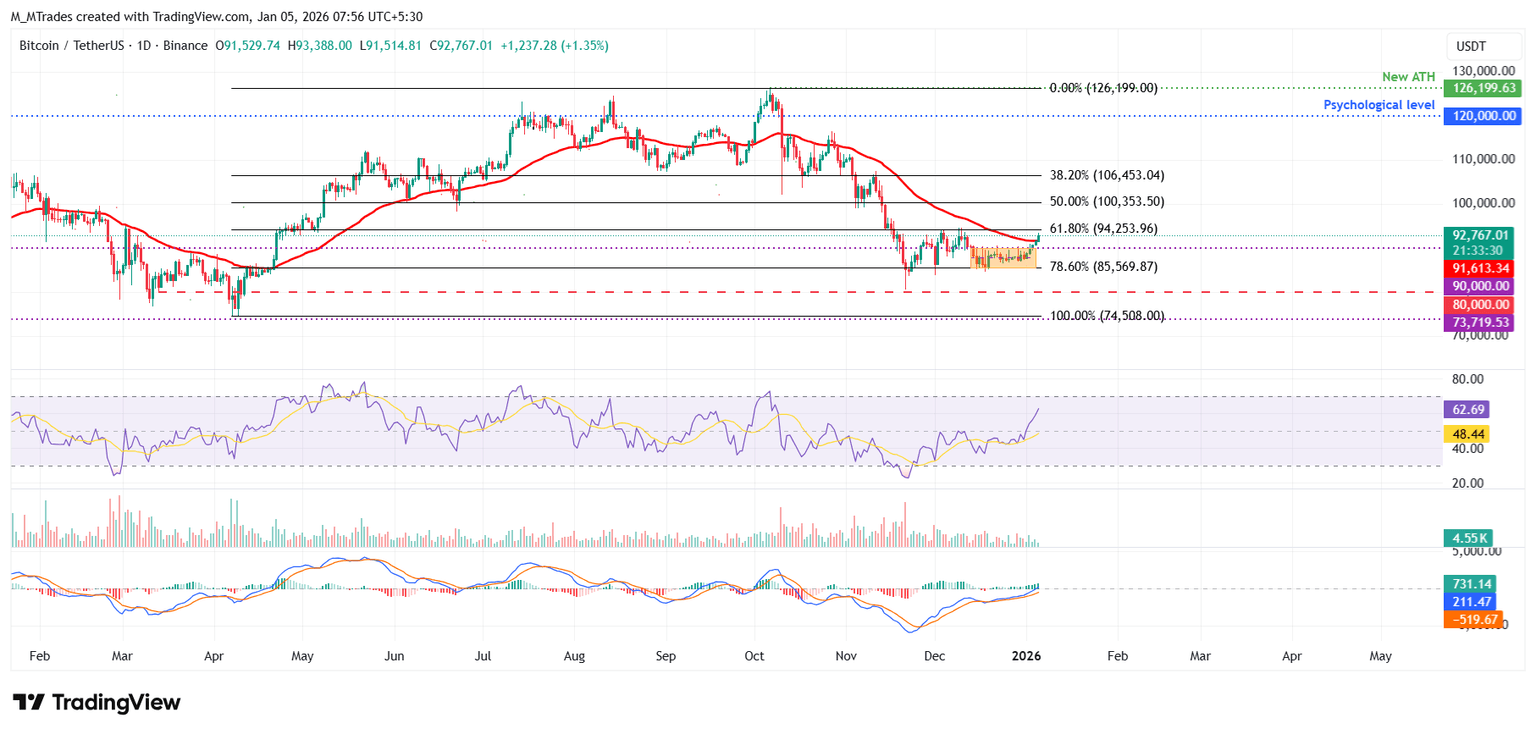
However, if BTC faces a correction, it could extend the decline toward the key support level at $90,000.
Ethereum gains momentum as it closes above its 50-day EMA
Ethereum price closed above the daily resistance level at $3,017 on Friday and rose slightly, closing above the 50-day Exponential Moving Average (EMA) at $3,120 on Sunday. As of Monday, ETH is trading above $3,190.
If the 50-day EMA at $3,120 holds as support, ETH could extend the rally toward the December 10 high of $3,447.
Like Bitcoin, Ethereum’s RSI and MACD indicate bullish signals, further supporting a positive view.
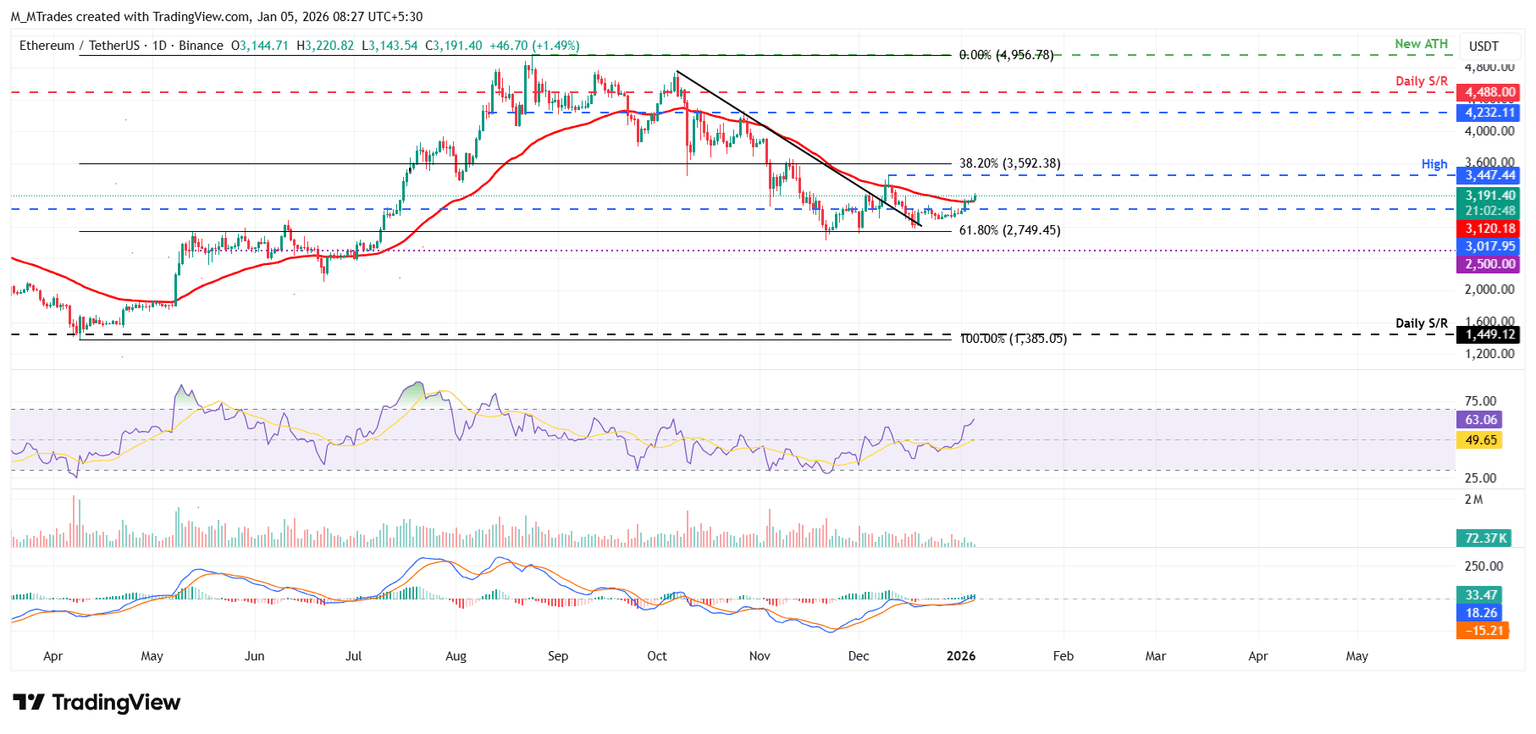
On the other hand, if ETH closes below the 50-day EMA at $3,120 on a daily basis, it could extend the decline toward the daily support at $3,017.
XRP bulls are in control of the momentum
XRP price rose nearly 7% on Friday and closed above the daily resistance level at $1.96. It continued to gain over the next two days, surpassing the 50-day EMA at $2.04. At the time of writing on Monday, XRP is trading above $2.14.
If XRP continues its upward trend, it could extend the rally toward the next key resistance at $2.35.
Like Bitcoin and Ethereum, XRP momentum indicators (RSI and MACD) showed bullish signals and support a positive outlook.
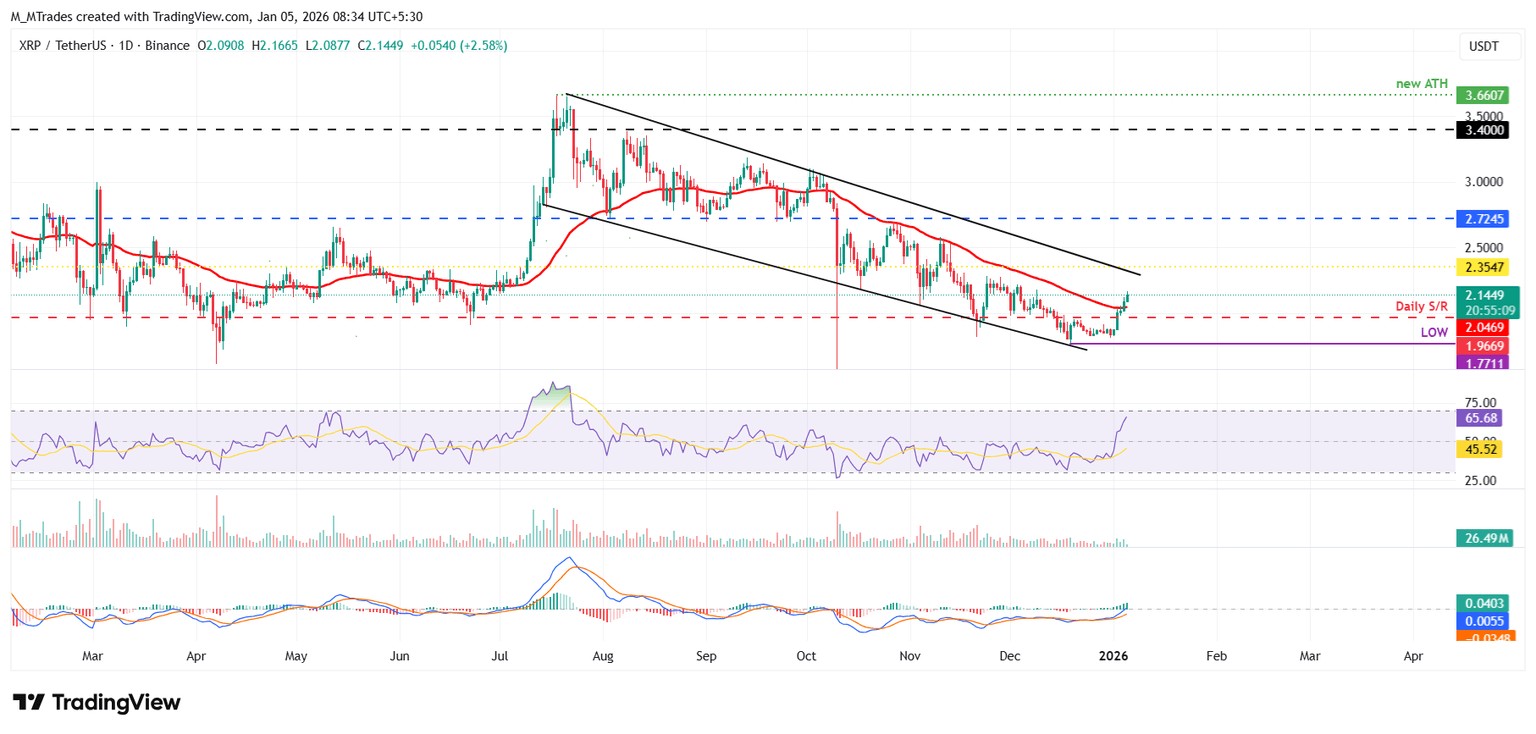
However, if XRP faces a pullback, it could extend the correction toward the 50-day EMA at $2.04.