S&P 500 — US Large Cap Index
 FTSE 100 — UK Blue Chips
 Euro Stoxx 50 — Eurozone Leaders
 DAX 40 — German Equities
 CAC 40 — French Market Index
 Nikkei 225 — Japan Benchmark
 Hang Seng — Hong Kong Index
 Shanghai Composite — China Mainland
 ASX 200 — Australian Market
 TSX Composite — Canada Index
 Nifty 50 — India Large Cap
 STI Index — Singapore Market
 KOSPI — South Korea Index
 Bovespa — Brazil Equities
 JSE Top 40 — South Africa Index
 IPC Index — Mexico Market
BlackRock shares jump 5% after earnings. What did the Wall Street giant report?


Key takeaways
- BlackRock shares rise after stronger-than-expected earnings
- The firm now manages $15.34 trillion in assets
- Earnings per share and revenue both exceeded Wall Street expectations
BlackRock (BLK.US), the world’s largest asset manager, reported second-quarter results that reinforced its central role in the global financial system. Despite already high expectations, the company delivered another strong earnings report that exceeded Wall Street forecasts, sending its shares nearly 5% higher in pre-market trading. BlackRock Q2 results
- Adjusted EPS: $13.91 (vs. $12.66 expected)
- Revenue: $7.08 billion (vs. $6.82 billion expected)
- Base fees and securities lending revenue: $5.73 billion (vs. $5.60 billion expected)
- Assets under management (AUM): $15.34 trillion (vs. $15.19 trillion expected)
- Long-term net inflows: $199.13 billion
- Total net inflows: $191.70 billion (vs. $175.92 billion expected)
BlackRock ended the quarter with a record $15.3 trillion in assets under management. The milestone was supported by $868 billion in net inflows and 10% organic growth in base fee revenue. Total revenue increased 31% year over year, driven by strong demand for ETFs, actively managed investment strategies, and technology services. At the same time, adjusted operating margin expanded to 45.9%, while diluted earnings per share increased 20% from a year earlier, highlighting the firm’s continued profitability.
iShares surpasses $6 trillion in assets
BlackRock iShares attracted $192 billion of net inflows during the second quarter of 2026, translating into 8% organic growth in base fee revenue. The scale of new capital demonstrates that the company continues to benefit both from the ongoing expansion of passive investing and from rising demand for more sophisticated investment strategies.
- Assets managed within the iShares platform surpassed $6 trillion, nearly doubling over the past three years. This is particularly significant for BlackRock, as iShares remains one of the company’s most important sources of scalable and recurring fee income.
- The company also recorded $53 billion of net inflows into actively managed strategies. Within equities, systematic strategies driven by quantitative models and data analytics were the primary growth engine, while liquid alternatives attracted a record $7 billion of net inflows.
BlackRock’s net income increased 20% year over year to $1.9 billion, while operating income also rose 20% to approximately $1.9 billion .
Wall Street’s positive reaction reflects not only stronger-than-expected revenue and earnings but also the broad-based nature of inflows across ETFs, active strategies, systematic investing, and alternative investments.
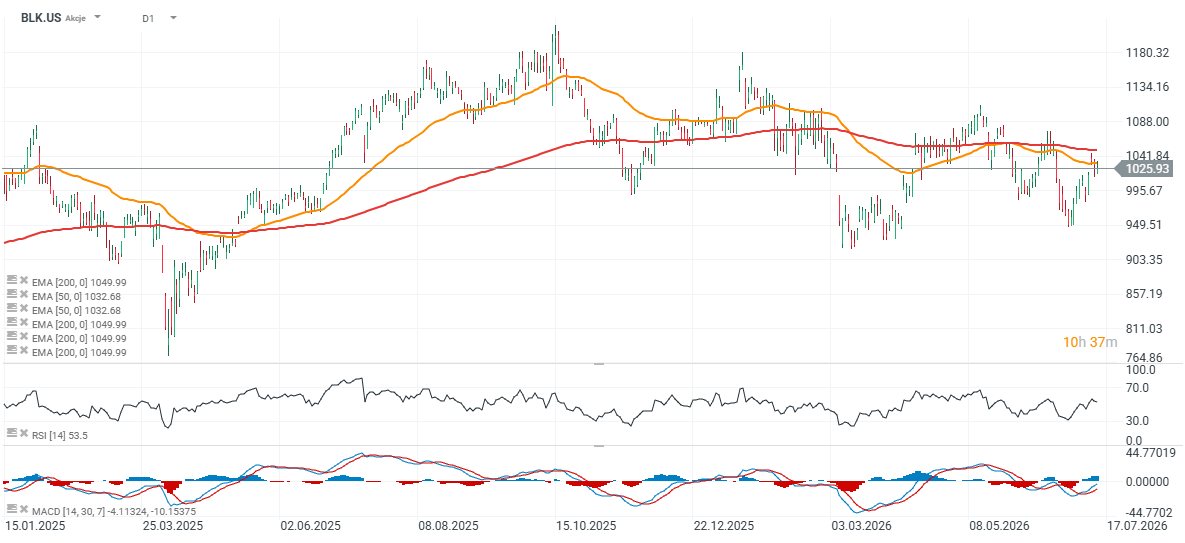
BlackRock shares (D1 chart)
At today’s session high, BlackRock shares traded above $1,200. This level appears to remain the key resistance for bulls, while the 200-day exponential moving average near $1,050 and the $910-$950 range represent potentially important technical support levels.
Source: xStation5