S&P 500 — US Large Cap Index
 FTSE 100 — UK Blue Chips
 Euro Stoxx 50 — Eurozone Leaders
 DAX 40 — German Equities
 CAC 40 — French Market Index
 Nikkei 225 — Japan Benchmark
 Hang Seng — Hong Kong Index
 Shanghai Composite — China Mainland
 ASX 200 — Australian Market
 TSX Composite — Canada Index
 Nifty 50 — India Large Cap
 STI Index — Singapore Market
 KOSPI — South Korea Index
 Bovespa — Brazil Equities
 JSE Top 40 — South Africa Index
 IPC Index — Mexico Market
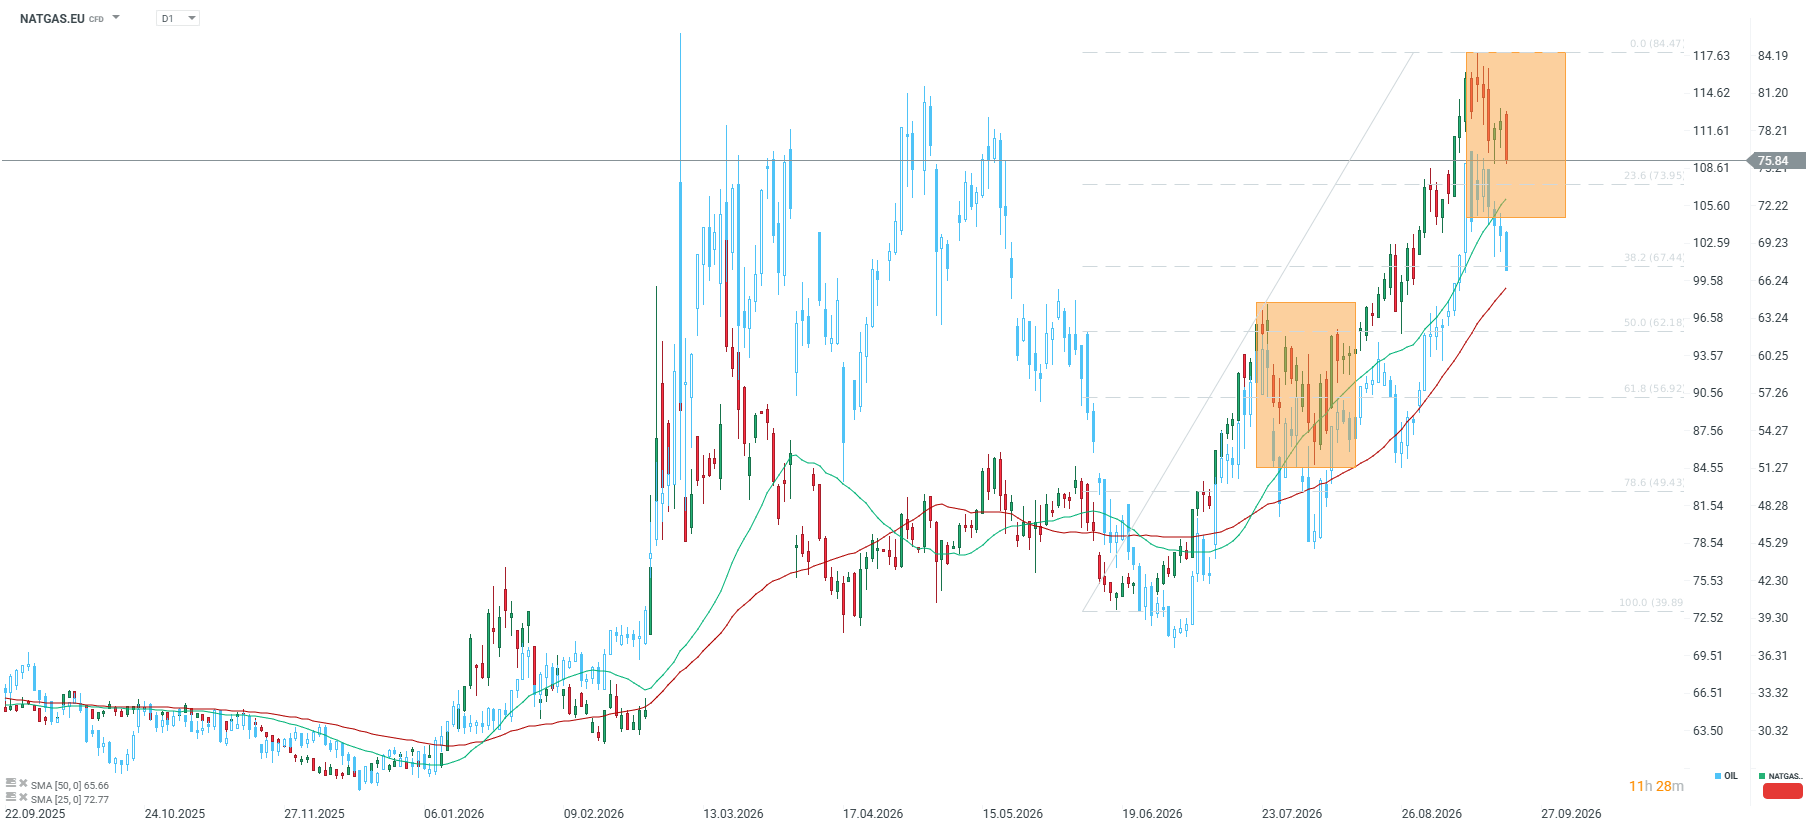
Chart of the Day: European Gas (NATGAS.EU) below 80 EUR, but Goldman Sachs warns of 105 EUR/MWh.


In the European gas market (Dutch TTF benchmark), we are observing a sharp sell-off today, with prices falling below the key level of 80 EUR/MWh. Recently, we have seen a strong correlation with oil prices, linked to shared concerns over Middle Eastern supply and rising demand in Asia for both oil and gas. Today, despite local calm, an analysis of market fundamentals and the latest forecasts from investment bank Goldman Sachs indicate that the European fuel market is entering the heating season on highly volatile ground.
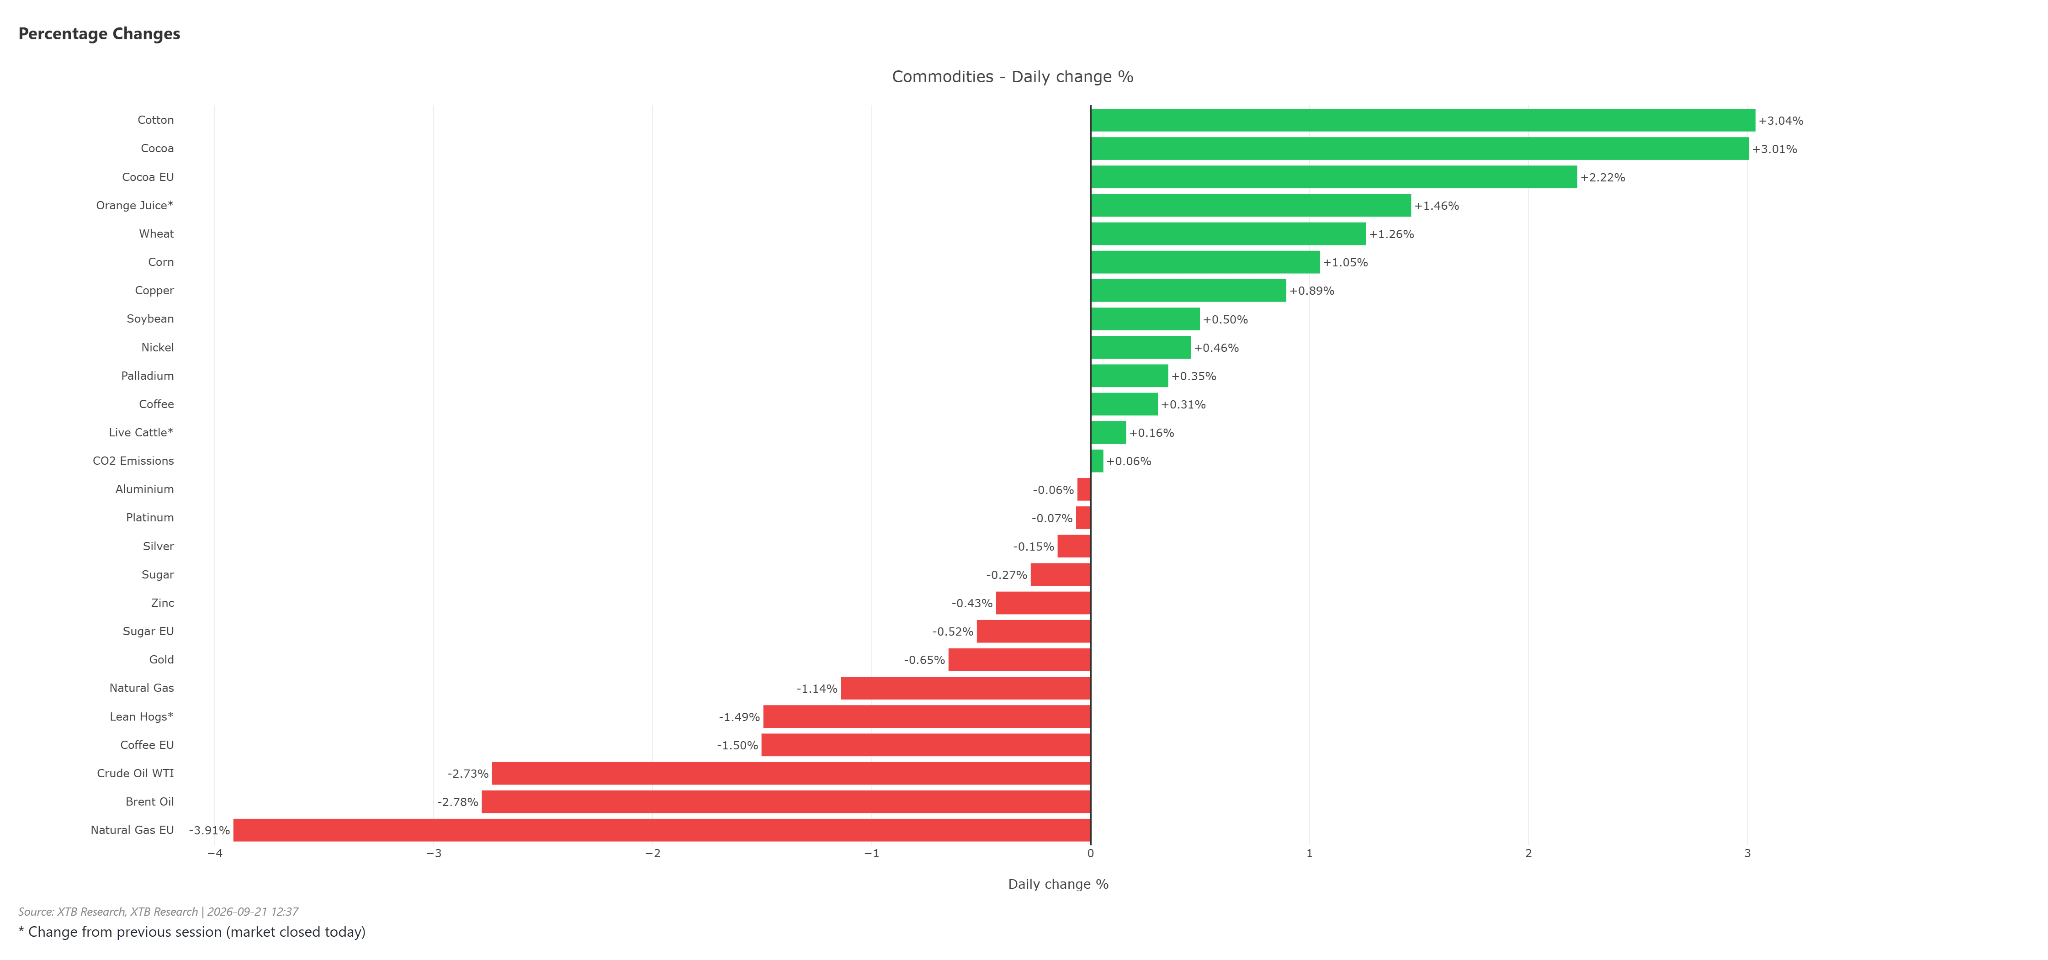
European gas leads today’s declines in the commodities market, following crude oil prices. Source: XTB
Why is gas falling today and what is the link to oil?
Today’s drop in natural gas prices on the TTF exchange shows a strong correlation with the situation in the broader energy commodities market, including crude oil.
- Common trade risk denominator: Oil and liquefied natural gas (LNG) share key logistical hubs, primarily the Strait of Hormuz. Any reports concerning supply continuity or military actions in the Middle East immediately translate into the pricing of risk premiums in both assets. A temporary easing of sentiment in the oil market directly leads to reduced buying pressure on gas contracts. Although official data indicates a significant drop in vessel traffic through the Strait of Hormuz, other data shows that over the past week, Saudi Arabia was able to transport up to 3 million bpd through the strait.
- The phenomenon of backwardation and withholding purchases: In the futures market, a discount structure is present (spot prices are higher than future prices). Analysts point out that European importers are intentionally withholding part of their purchases in hopes of further price declines, fearing to buy fuel at local peaks.
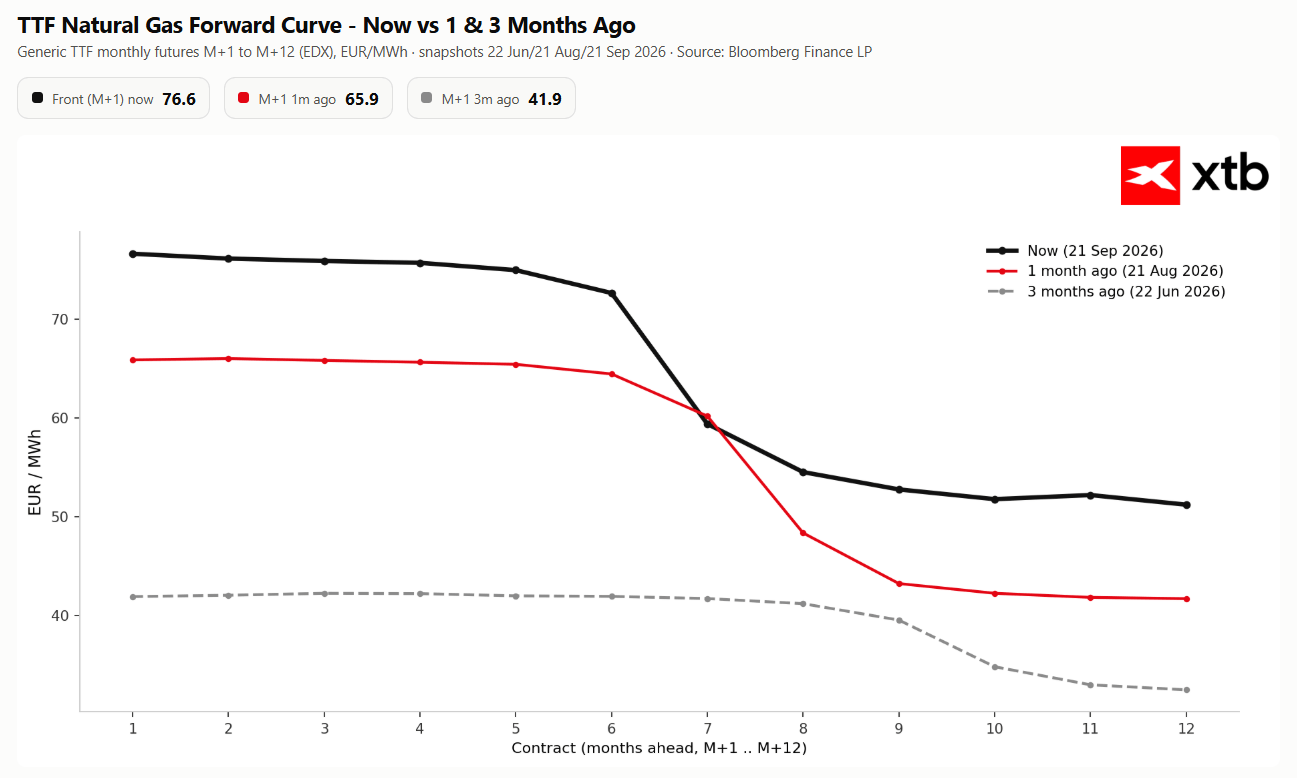
The huge gap between current prices and summer prices does not encourage restocking. Buying at high prices now means selling at a loss later. Source: Bloomberg Finance LP, XTB
Market fundamentals in Europe: Low storage levels and the flight of US LNG
While investors react to news headlines, hard market data from September 2026 points to a growing supply deficit in Europe.
- EU storage fill level: According to data as of September 21, 2026, European gas storage facilities are filled at 69.4%. This level is significantly lower than the 5-year average for this period (85.1%) and lower than the level recorded in the same period of 2025 (81.6%).
- Outflow of LNG volumes to Asia and Egypt: For the first time in a while, less than 42% of US LNG exports headed to Europe (down from over 50% a month earlier). American suppliers redirected cargoes to Asia due to a higher price premium on the JKM index ($17.33/MMBtu vs $13.19/MMBtu on TTF) and to Egypt, which imported a record 1.06 million tons of fuel.
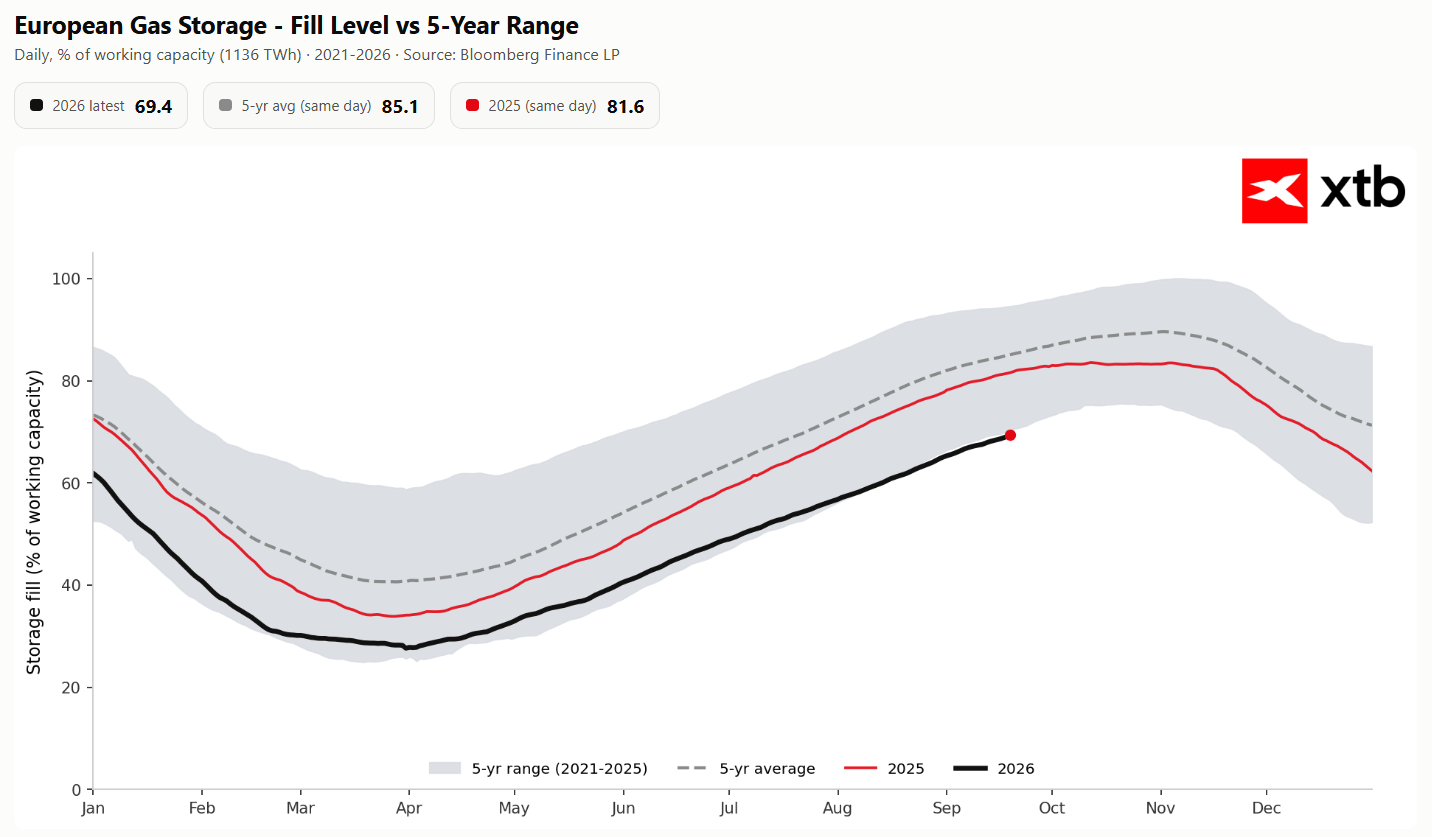
Storage capacity levels are significantly lower than the 5-year average and last year’s levels. Source: Bloomberg Finance LP, XTB
Goldman Sachs warns: Base case and extreme risk scenario
Goldman Sachs issued a report warning that the gas market is currently pricing in a “two-sided game” dependent on the functionality of sea routes in the Persian Gulf.
Base Case Scenario
- Target TTF price: approx. 70 EUR/MWh (~25 USD/MMBtu) by the end of the year.
- Assumptions: Gradual normalization of LNG transport through the Strait of Hormuz and moderate winter weather conditions.
Bull Case Scenario (Extreme Risk)
- Target TTF price: 105 EUR/MWh (~35 USD/MMBtu).
- Assumptions: Continued blockades or disruptions in Persian Gulf LNG exports under average winter weather conditions.
Demand Destruction Mechanism
Goldman Sachs estimates that crossing the threshold of 30 USD/MMBtu (approx. 88–90 EUR/MWh) will trigger a sharp drop in industrial demand. In Asia (e.g., India), industry will begin curtailing gas consumption, and in China, a massive switch from gas to cheaper coal will occur.
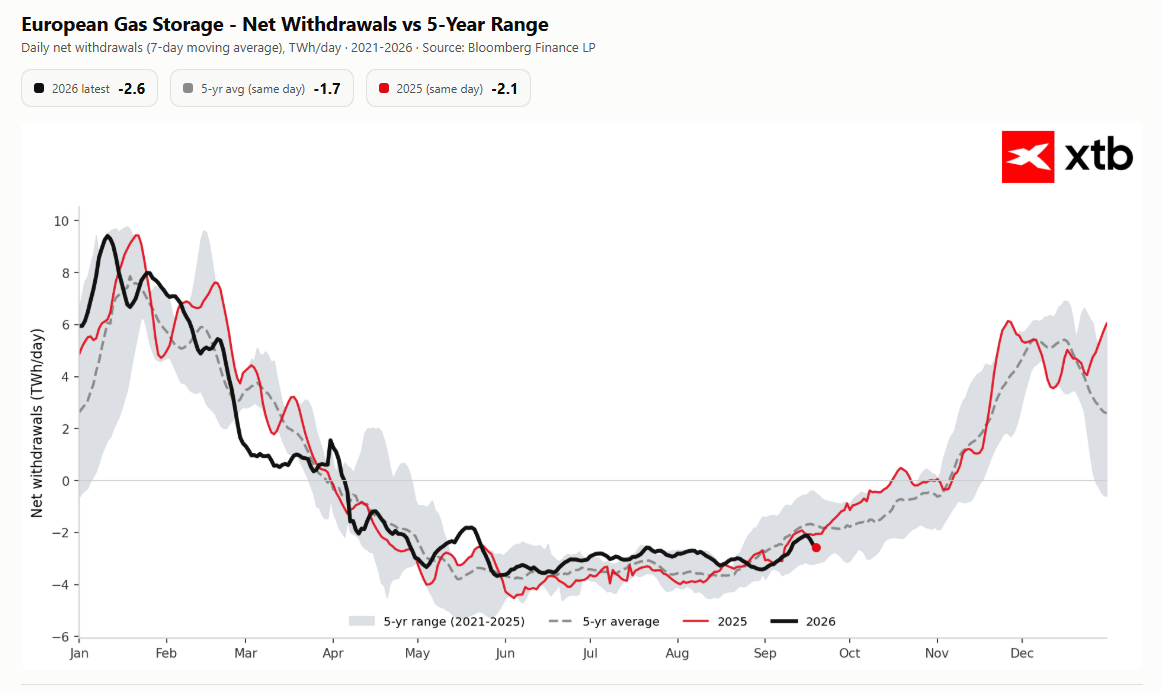
At the moment, gas withdrawals from European storage systems are running below the 5-year average. Hope for European consumers lies in a delayed start to the heating season, as occurred during strong El Niño years like 2015 and 2023. Source: Bloomberg Finance LP, XTB
Macroeconomic Pressure and the ECB
An increase in TTF prices toward the projected 105 EUR/MWh would immediately translate into higher energy costs for European industry and households. This could spark a second wave of inflation, forcing the European Central Bank (ECB) to reconsider interest rate hikes.
Summary and Technical Analysis
The current price pullbacks on the TTF exchange are purely tactical and technical in nature. The fundamental supply-demand balance in Europe remains tight due to lower storage inventories (69.4%) and price competition for LNG cargoes with the Asian market. From a technical standpoint, European gas remains in a clear uptrend that pushed prices from around 40 in the second half of June up to the 84.47 area, where a local peak formed. We are currently observing a correction of this dynamic move, with the price retracing to 75.82 toward the 23.6% Fibonacci retracement at 73.95. This is the first significant test for buyers following the recent bullish wave. The structure still favors the bulls. Quotes remain above both key moving averages—the SMA25 at 72.77 and the rising SMA50 at 65.66, with the moving averages aligned in a classic bullish trend. Importantly, the 23.6% retracement zone nearly coincides with the SMA25, creating double support between 72.80 and 73.95. Defending this area would signal that this is merely a breather before another attempt at the highs. Holding this support opens the door to retesting the 84.47 barrier, and breaking above it would continue the move north. An alternative scenario activates only upon a sustained break below 72.77, which would turn attention toward the 38.2% retracement at 67.44, reinforced by the SMA50 at 65.66. However, as long as price holds above the moving average cluster, the bulls maintain the advantage, with energy supply disruptions acting as the fundamental fuel for further gains.