S&P 500 — US Large Cap Index
 FTSE 100 — UK Blue Chips
 Euro Stoxx 50 — Eurozone Leaders
 DAX 40 — German Equities
 CAC 40 — French Market Index
 Nikkei 225 — Japan Benchmark
 Hang Seng — Hong Kong Index
 Shanghai Composite — China Mainland
 ASX 200 — Australian Market
 TSX Composite — Canada Index
 Nifty 50 — India Large Cap
 STI Index — Singapore Market
 KOSPI — South Korea Index
 Bovespa — Brazil Equities
 JSE Top 40 — South Africa Index
 IPC Index — Mexico Market
The information and opinions expressed below are based on my analysis of price behavior and chart activity
Thursday, May 1, 2025
July Soybean Oil (Daily)
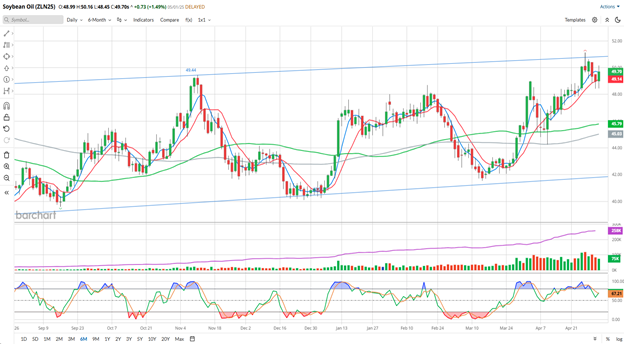
Today, July Soybean Oil closed at 49.70, up 0.73 on the day. Since then, Bean Oil has rallied to hit a high of 51.13 last Friday, testing the blue overhead trendline resistance. As you may see on the chart above, the last time it interacted with that trendline, prices immediately fell back. That peak was in November of last year. And if you could scroll back in time (sorry, static image above) you might notice it behaved in a similar manner when it made a peak in July of last year. This time, I think it might be acting differently. You may see that all of this year, the Bean Oil market is making new highs for the move, but not making new lows. For example, a peak at 48.69 on Feb 19th, a new high for the calendar year, followed by a low of 41.54 on March 13th, which was not a new low for the calendar year. The market behaved in a similar manner following the peak in early April. And this time? The market hasn’t exactly sold off very aggressively. Monday’s trade this week, immediately following the high at 51.13 was higher, closing up 0.65 from Friday’s settlement. Tuesday and Wednesday were weaker, but the 10-day moving average (red, 49.14) has held as support and today’s gains nearly got the market back to where it began the week and the price is back above the 5-day average (blue, 49.65). I still like this market from the long side, but please read on to find out more. Aggressive and well-margined traders may do well to consider long positions, perhaps near Wednesday’s high of 49.50 or the 10-day average at 49.14, with a risk/reverse just below Wednesday’s low which was 48.43.
July Soybean Oil (Weekly)

The weekly July Soybean Oil chart shows a bit more of what I was referring to above. Looking at that upper blue trendline, notice the weeks that followed the peaks in July and November were large red (down) weeks/bars. So far this week, no big red bar and this week’s bar is looking more like a Doji (opening and closing at the same price) than anything else. We still have tomorrow’s trade to close out that bar and the week, but I think this is a good sign. I see support on the weekly chart at the 5-week average (blue, 48.39) the 100-week (grey, 47.20) and the 10-week average (red, 46.06) Overhead resistance might be found near the big, round number of 50.00 and the up to last week’s high of 51.13. From there, I don’t see much on this chart until the price gap at 55.62 back in September of 2023. That might seem like an unreachable target, as we haven’t traded up there since 2023. And I’m of the opinion that futures market tend to fill gaps. It might take a while, but eventually it should get filled. There are other gaps, further back in time and higher in price, as well. Stochastics (subgraph) are a bit overbought, but you may notice that markets can maintain that overbought/oversold status for extended periods. The market is trading above all of the moving averages pictured, which I think is friendly to prices. The 5- and 10-week averages made a bullish crossover a couple of weeks ago and are still pointing toward higher prices. It will likely take a sharp and/or extended move higher before the 50 and 100-weeks crossover.