S&P 500 — US Large Cap Index
 FTSE 100 — UK Blue Chips
 Euro Stoxx 50 — Eurozone Leaders
 DAX 40 — German Equities
 CAC 40 — French Market Index
 Nikkei 225 — Japan Benchmark
 Hang Seng — Hong Kong Index
 Shanghai Composite — China Mainland
 ASX 200 — Australian Market
 TSX Composite — Canada Index
 Nifty 50 — India Large Cap
 STI Index — Singapore Market
 KOSPI — South Korea Index
 Bovespa — Brazil Equities
 JSE Top 40 — South Africa Index
 IPC Index — Mexico Market

Record session, although the record requires comment
Monday’s session on Nasdaq 100 futures brought massive gains, the largest in a long time, with the US100 logging its best day since early August. Futures closed at new historical highs around the 30,820 point level, although it is worth adding a small asterisk right away. This new record on futures contracts is largely the result of the recent contract rollover after September 16, which raised the reference level. The cash index has not yet established a new peak, as its all-time closing high stands at 30,660.60 from June 2, and intraday at 30,762.20 from June 3, 2026, while on Monday it traded around 30,482. In other words, futures formally hit a record, but the cash market is still chasing its June highs and has not yet set a new intraday peak.
What fueled demand
Fueling the rally was a mix of geopolitics and artificial intelligence euphoria. The market reacted to reports that Donald Trump might meet with Iran’s president on the sidelines of the UN General Assembly, reinforcing hopes for unblocking shipping through the Strait of Hormuz. The result was a sharp sell-off in oil, with Brent crude briefly dropping below $100 per barrel, which in turn dragged down US bond yields, with the 10-year yield falling to 4.96 percent. Cheaper oil and lower yields represent a classic environment favoring growth and tech stocks.
Stock volatility during the last session
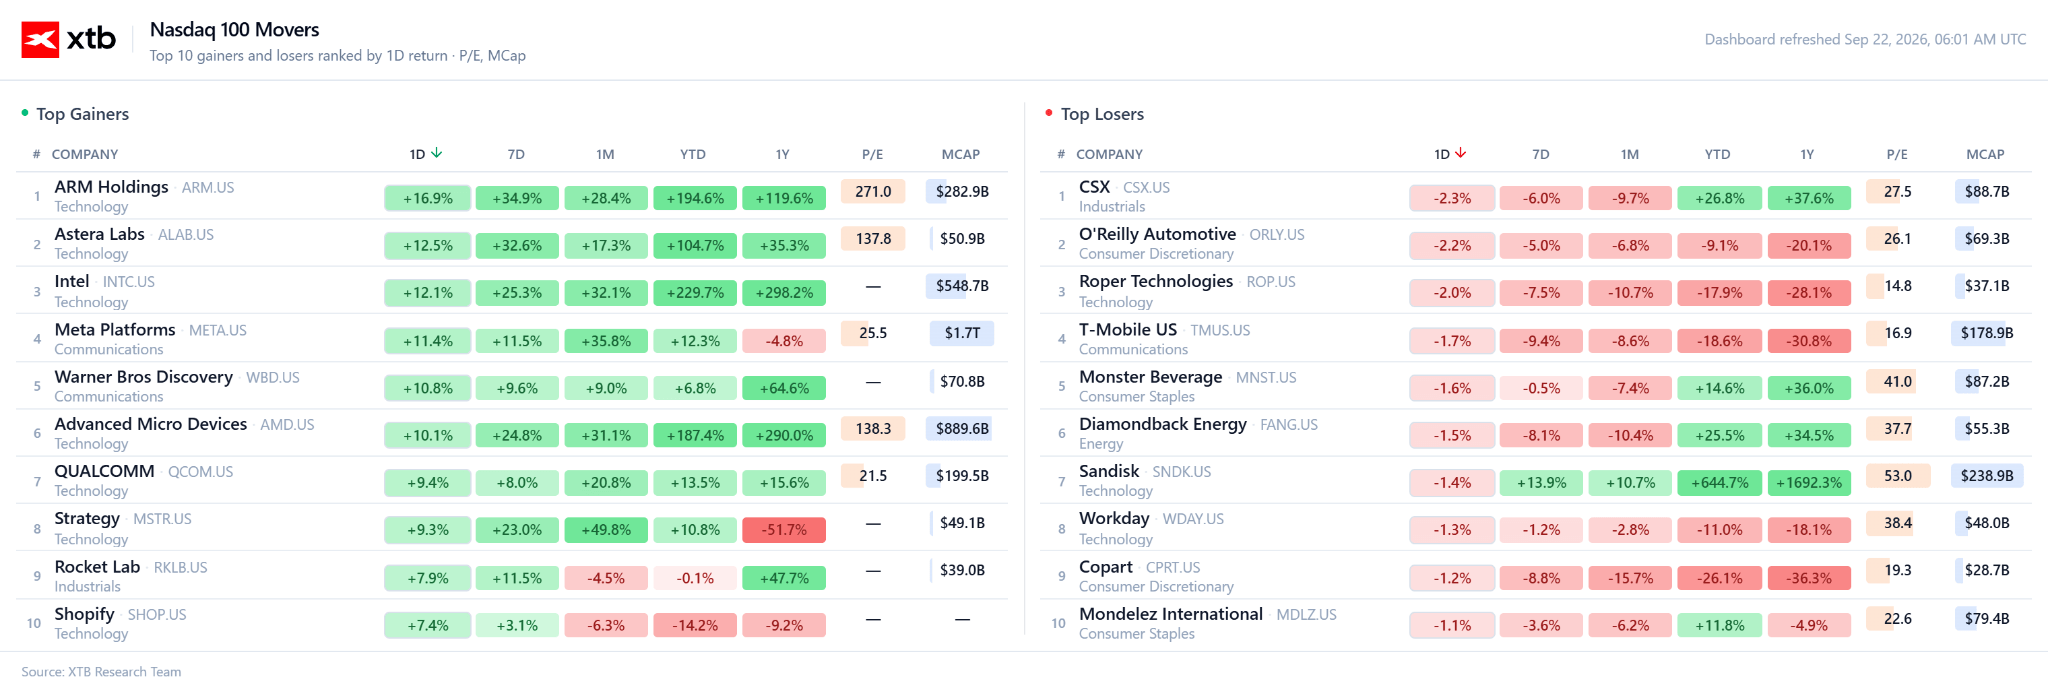
The session showcased extreme volatility across the semiconductor and megacap sectors. Leading the gainers was Arm Holdings, soaring nearly 17 percent, closely followed by Intel with a gain of over 12 percent. The real star, however, was AMD, which gained about 10 percent and crossed a trillion-dollar valuation for the first time in history. Additionally, Meta Platforms surged 11.4 percent, adding nearly $200 billion in market capitalization in response to optimism surrounding its AI ambitions and the Muse assistant. For Meta, this was the best day since the tariff turmoil of April 2025. Warner Bros Discovery and Astera Labs also performed strongly, each gaining over 8 percent. On the other side of the table were defensive and industrial stocks, such as CSX and O’Reilly, confirming a pure sector rotation toward risk assets.
Fundamentals and market breadth
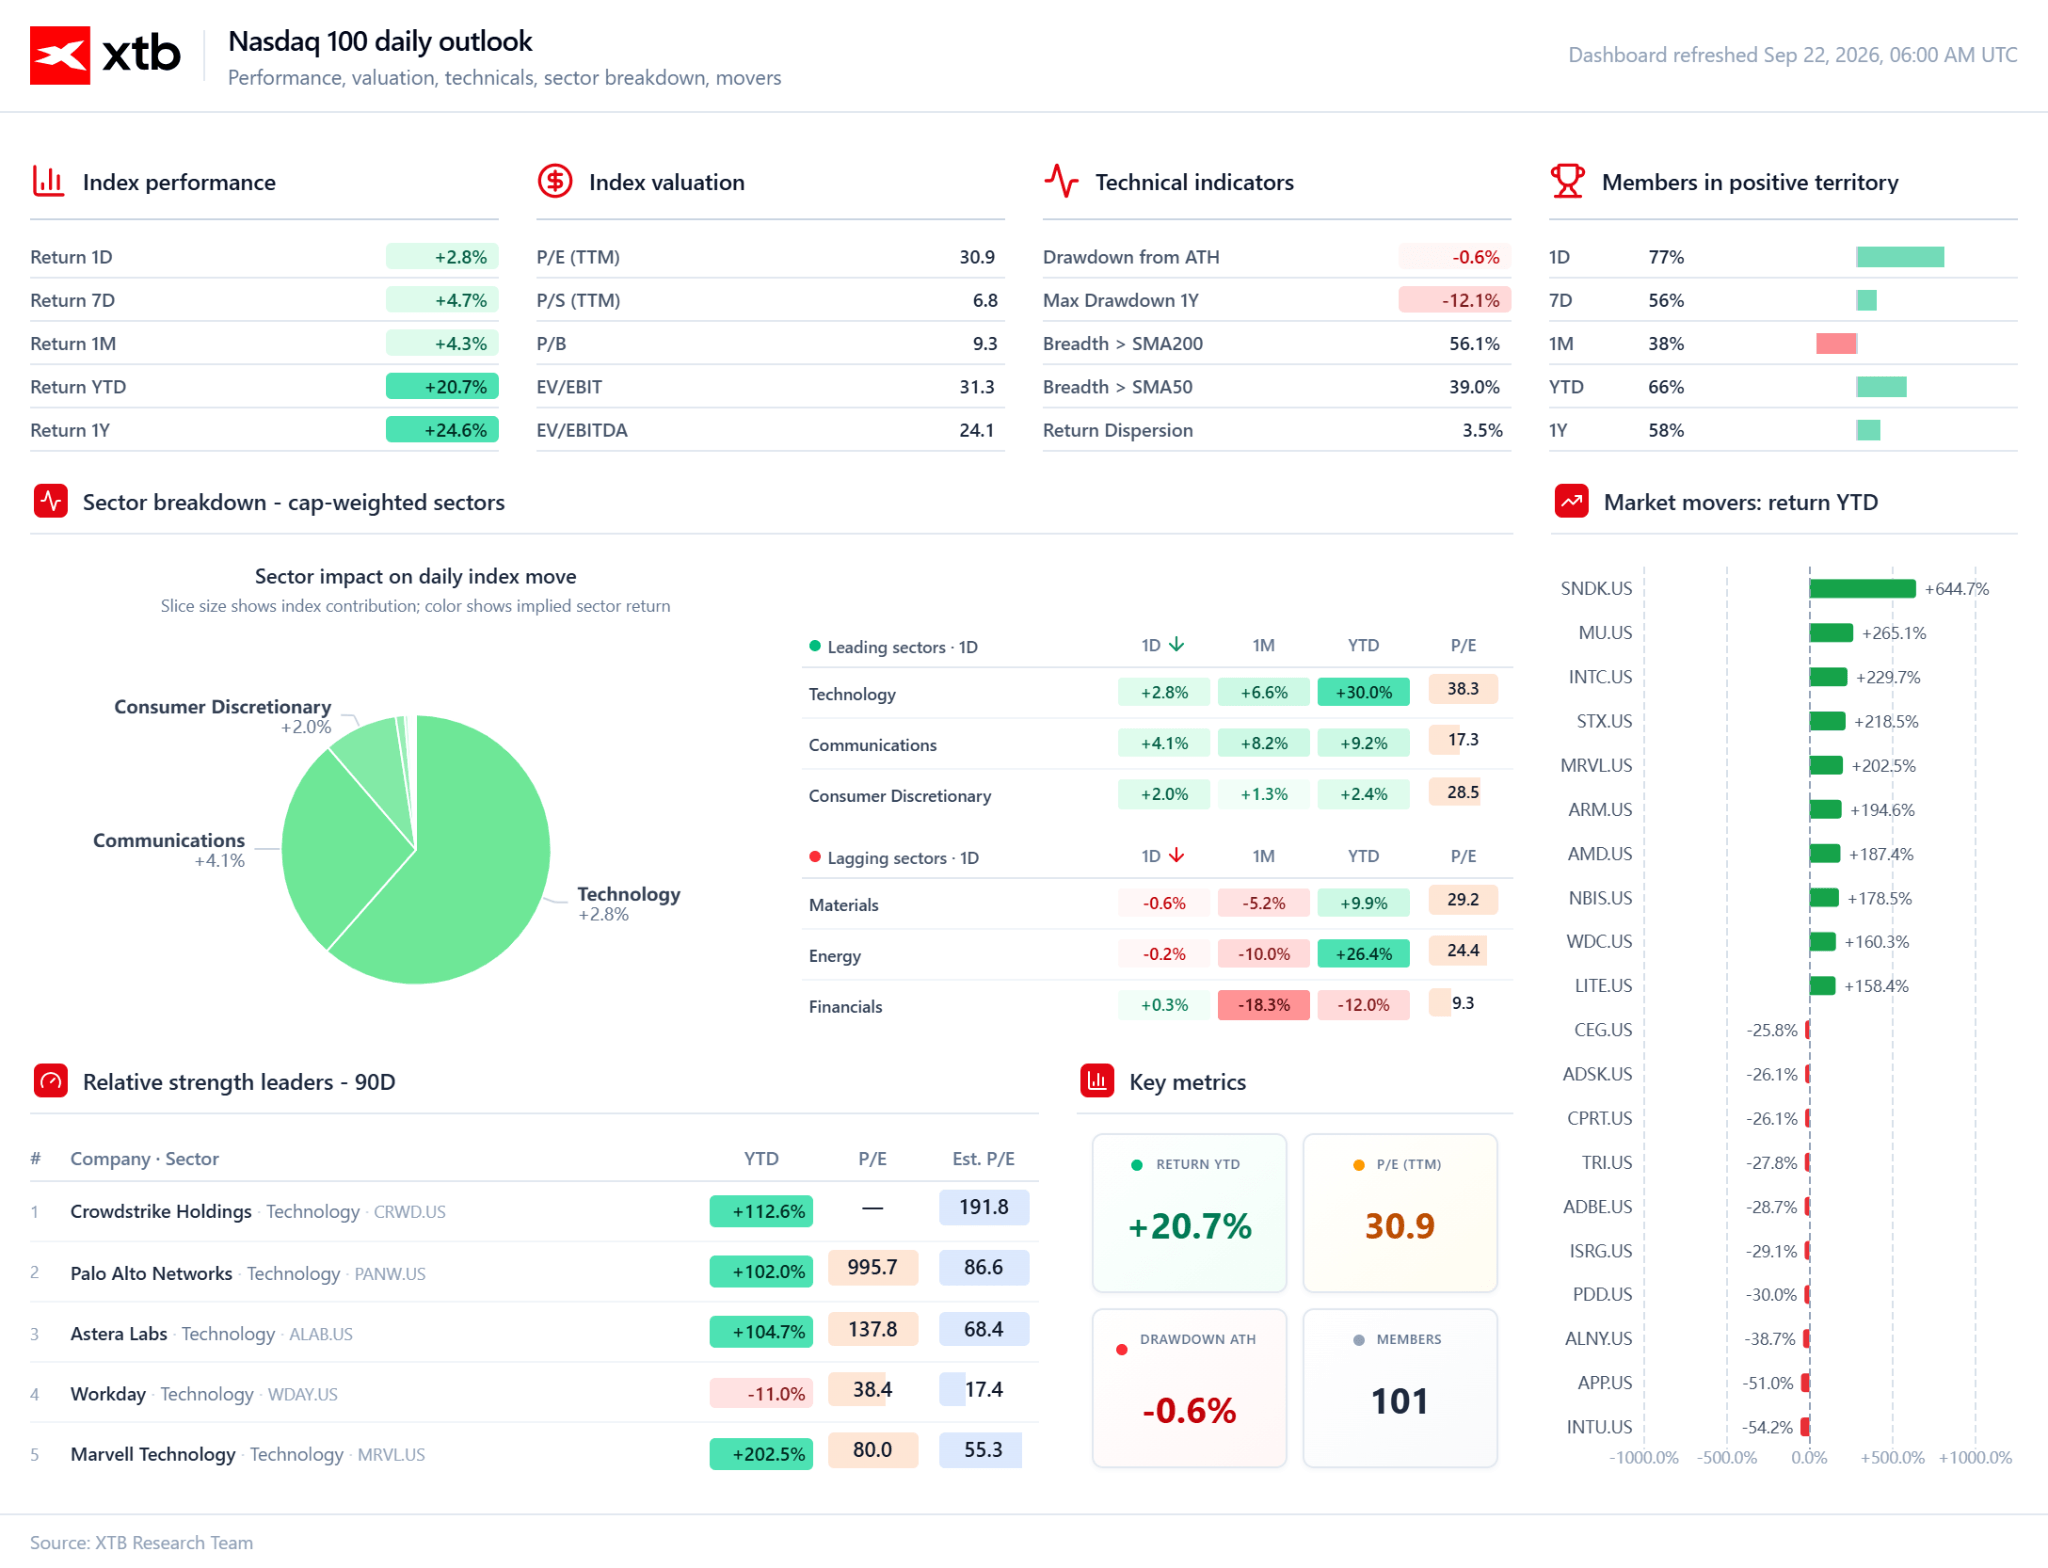
From a fundamental perspective, the Nasdaq 100 remains an expensive index, trading at a price-to-earnings ratio of 30.9 and a price-to-sales ratio of 6.8, with an EV/EBITDA of 24.1. These demanding valuations are justified only by the earnings momentum of AI companies. The index itself has had a very strong year, with a YTD return of 20.7 percent and 24.6 percent on an annual basis, while the drawdown from its historical high is a mere 0.6 percent. A crucial nuance, however, lies in market breadth. Despite the index hovering near record highs, only 39 percent of member stocks are trading above their 50-session moving average, and 56 percent above their 200-session moving average. This signals that the bull market is driven by a narrow group of tech giants and chipmakers rather than the broader market. Such concentration boosts index value while simultaneously leaving it vulnerable to potential stumbles by a few key companies.
Technical analysis
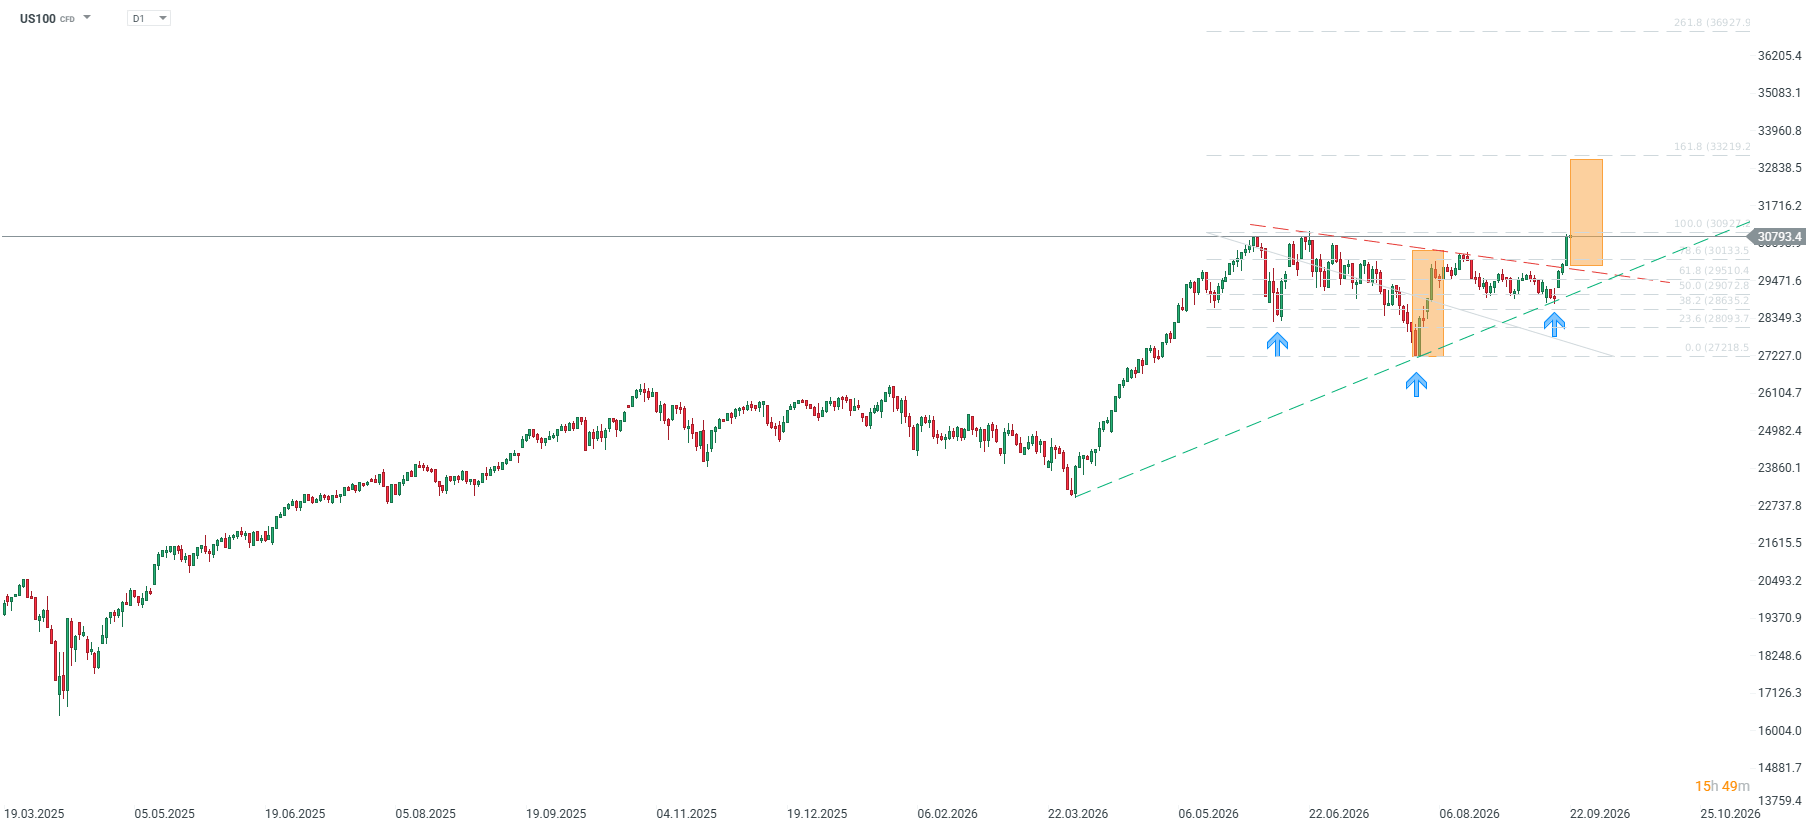
On the daily US100 chart, Monday’s candle formed a powerful, wide breakout that propelled prices to new highs around 30,820. The market is currently testing round-number resistance and the 100 percent Fibonacci extension level at 30,927; a sustained breakout above this area would open the path toward subsequent Fibonacci targets, namely the 161.8 percent extension at 33,219. The overall structure remains decisively bullish, with the momentum supported by an ascending trendline drawn from the March 2026 low. However, it is worth noting that a pullback from current levels could potentially open the door to a double or even triple top formation, although the inverse head and shoulders (iH&S) breakout scenario is currently playing out. Following the neckline breakout, initial support lies around 30,133 (the 78.6 percent retracement level), while a deeper correction would pull focus toward the 29,510 zone and the moving averages. As long as prices hold above 30,133 and the aforementioned trendline, buyers retain technical control. Nevertheless, after such a strong candle, a brief pause would be natural, and the real test of buyers’ strength will be the cash market’s ability to close decisively above the June high of 30,762.