S&P 500 — US Large Cap Index
 FTSE 100 — UK Blue Chips
 Euro Stoxx 50 — Eurozone Leaders
 DAX 40 — German Equities
 CAC 40 — French Market Index
 Nikkei 225 — Japan Benchmark
 Hang Seng — Hong Kong Index
 Shanghai Composite — China Mainland
 ASX 200 — Australian Market
 TSX Composite — Canada Index
 Nifty 50 — India Large Cap
 STI Index — Singapore Market
 KOSPI — South Korea Index
 Bovespa — Brazil Equities
 JSE Top 40 — South Africa Index
 IPC Index — Mexico Market
Chart of the Day – S&P 500 extends gains, supported by CTA fund buying


US500, the US S&P 500 index futures, is trading higher during Wednesday’s morning session, supported by signals from Donald Trump, who indicated an indefinite extension of the ceasefire with Iran while awaiting a final, joint stance from Tehran. In recent weeks, gains in the S&P 500 appear to be significantly driven by buying activity from algorithmic Commodity Trading Advisors (CTAs), as confirmed by Goldman Sachs Prime data. After today’s US session, Tesla and IBM – both key index components are set to report earnings.
Are CTAs still buying?
Goldman Sachs signals that CTA buying potential in the S&P 500 remains positive in the short term, although it has weakened compared to a week ago. In practice, this means that over the coming week, trend-following strategies may still support Wall Street regardless of the market scenario.
- In a flat market scenario, Goldman estimates roughly $16 billion of buying over the next week. Over a one-month horizon, this drops to around $14 billion—significantly lower than previous forecasts of over $45 billion.
- In a strong upside scenario, the model still points to positive CTA flows: about $16 billion over a week and roughly $17 billion over a month. However, this too marks a clear cooling from earlier expectations, which were closer to $50 billion.
- The most notable shift appears in a downside scenario. In the short term, even with a sharper sell-off, CTAs would still be net buyers—around $16.5 billion over a week. The issue emerges over a longer horizon: in this case, the model points to roughly $19 billion of selling over the following month.
- This marks an important shift in tone, as just a week ago even a weaker market scenario still showed a slightly positive flow. Now, it appears that the medium-term demand cushion is beginning to fade.
- This change is driven by the rebuilding of CTA positioning. The more buying has already taken place, the less mechanical demand remains for the weeks ahead.
- In other words, short-term support for the S&P 500 has not disappeared, but its strength is gradually weakening. The market may still benefit from systematic buying flows, although the impulse is no longer as strong as before.
- Notably, the pace of global equity buying by CTAs over the past week ranked among the top five strongest episodes on record, totaling around $86 billion. The model also pointed to an additional $70 billion of potential demand over the following five sessions in a stable market environment.
- Historically, such rapid buying waves have often led to short-term consolidation, followed by renewed upside. According to Goldman Sachs, average returns for the S&P 500 in similar episodes were around +2.2% after one month and over +8% after three months.
From an investor perspective, the takeaway is relatively straightforward: in the short term, CTAs are still supporting the market, but over the medium term this effect is becoming less certain especially if a stronger wave of selling emerges on Wall Street.
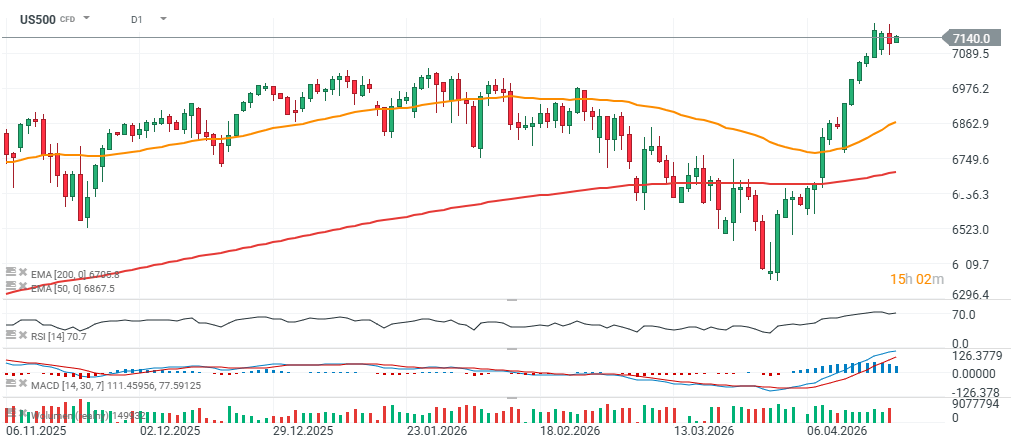
US500 (D1 chart)
S&P 500 futures (June contract) continue to show positive momentum, but the market is entering overbought territory, suggesting some caution is warranted. A short-term bullish signal emerged after breaking above the 9-period moving average, supporting the continuation of the uptrend. At the same time, a negative technical signal appeared in the form of a daily price reversal, which could point to a temporary slowdown in the trend—although buyers quickly stepped back in. Another mild warning sign is the close below the local pivot level, indicating that buying pressure is no longer as strong as before. RSI has moved above 70, confirming overbought conditions and increasing the risk of a short-term correction. The nearest upside targets are in the 7170–7230 range, while immediate support levels are around 7075 and then near 7030.
Source: xStation5