S&P 500 — US Large Cap Index
 FTSE 100 — UK Blue Chips
 Euro Stoxx 50 — Eurozone Leaders
 DAX 40 — German Equities
 CAC 40 — French Market Index
 Nikkei 225 — Japan Benchmark
 Hang Seng — Hong Kong Index
 Shanghai Composite — China Mainland
 ASX 200 — Australian Market
 TSX Composite — Canada Index
 Nifty 50 — India Large Cap
 STI Index — Singapore Market
 KOSPI — South Korea Index
 Bovespa — Brazil Equities
 JSE Top 40 — South Africa Index
 IPC Index — Mexico Market
Chart of the Day: USD/JPY Recovers After Disappointing Payroll Data


The USD/JPY exchange rate quickly recouped most of the losses triggered by the weak US labour market report and is trading on Monday around 158.20–158.50, virtually where the pair stood prior to the data release. Friday’s payrolls figures showed a fall in employment of 23,000 against an expected increase of 80,000, triggering a sharp sell-off in the dollar and sending USD/JPY down from around 158.30 to approximately 156.70, before buyers quickly returned to the market. The market’s attention is now turning to Wednesday’s release of the US CPI for July, which will determine whether the Federal Reserve still has scope for a rate rise in September.
What the daily chart shows
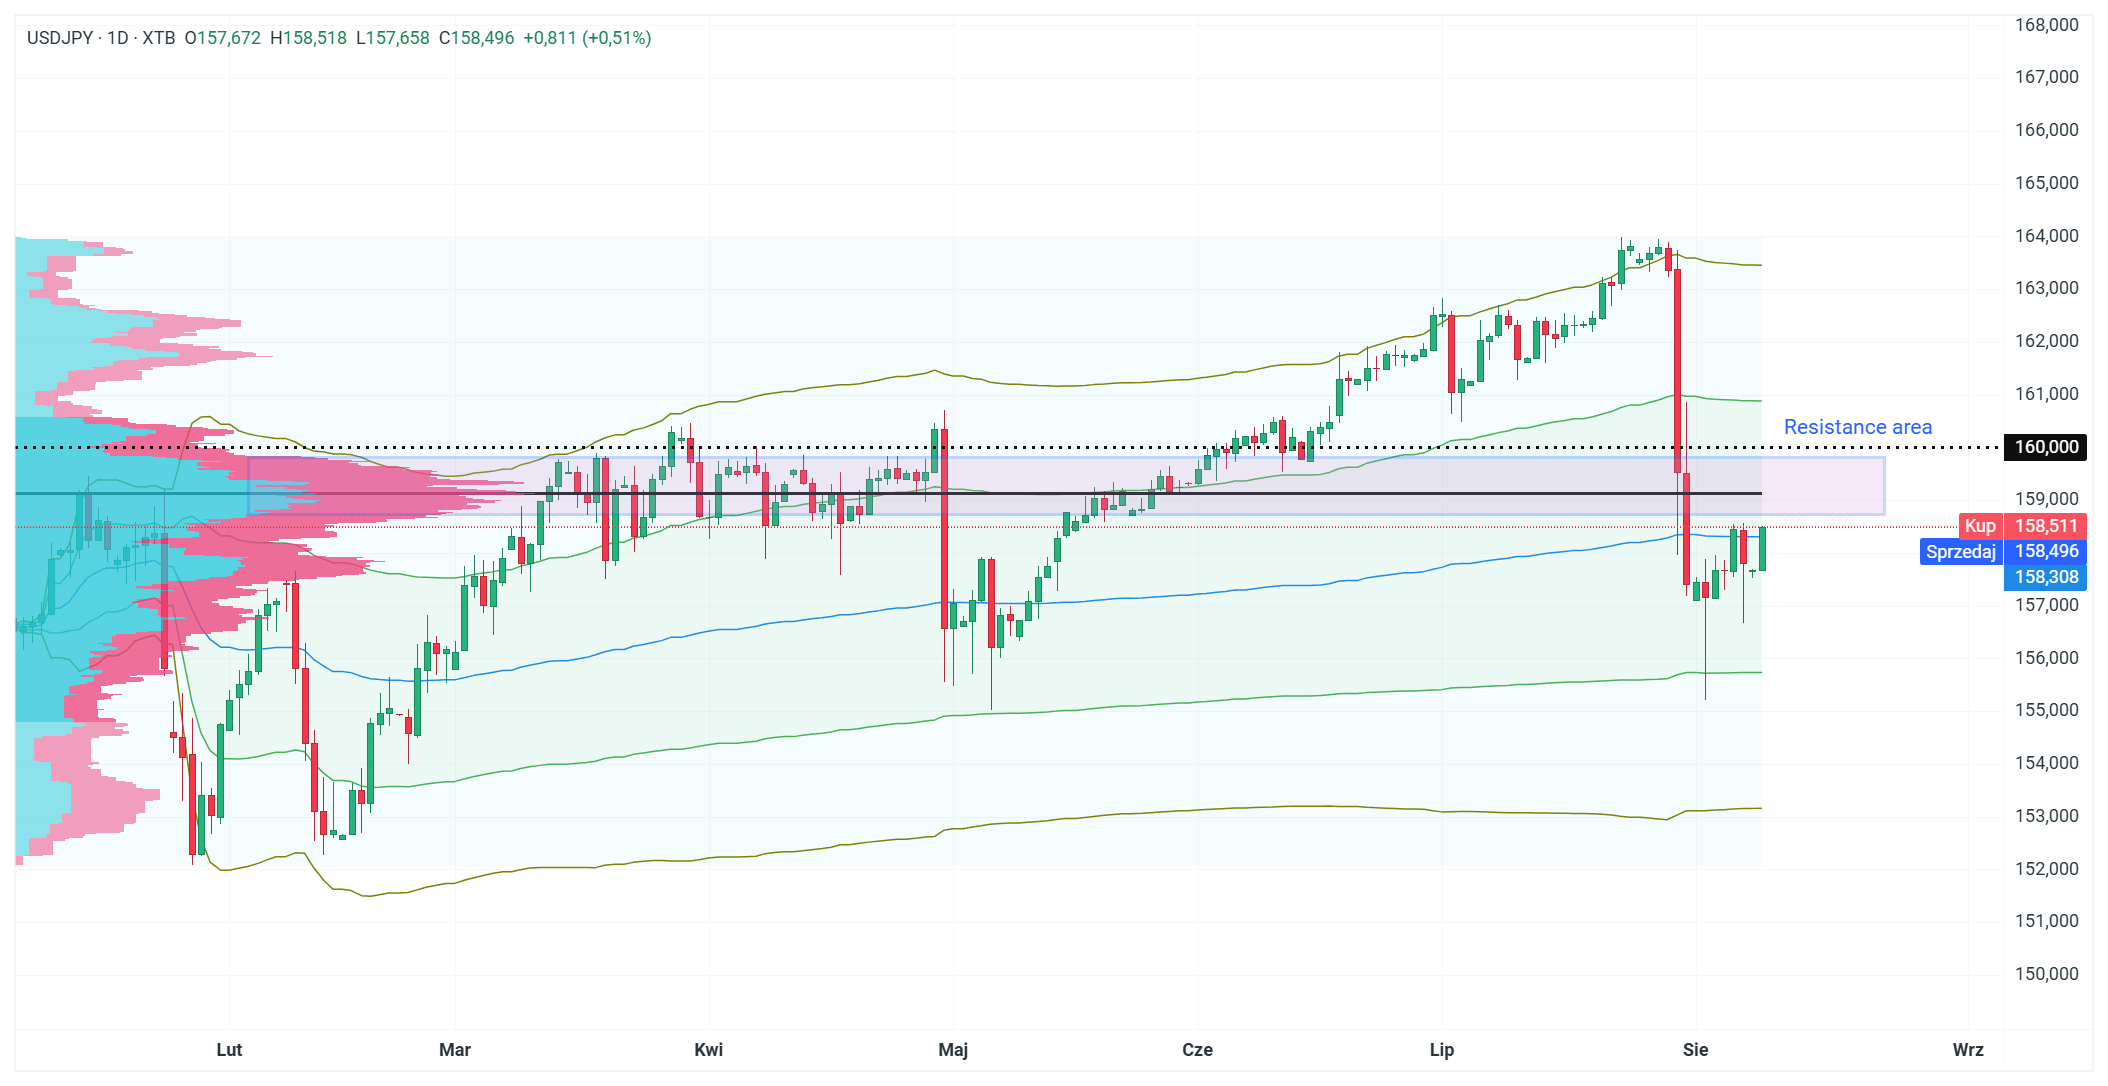
The attached daily USD/JPY chart (D1 timeframe) shows a clear, well-defined uptrend that has been in place since February, with the price moving consistently along or above one standard deviation below the anchored VWAP since the start of 2026 (as the main support zone for the long-term uptrend). A key element of the chart pattern is the broad resistance zone around 159,000–160,000, marked on the chart as “Resistance area” – the same level which previously, from March to May, acted as a consolidation zone and repeatedly rejected price movements (and currently constitutes the main cluster of the value zone when looking at the volume profile marked since the start of the year), Friday’s long red candle with a long lower shadow was a reaction to the weak payrolls figures – there was a sharp fall from around 163,000–164,000 towards the resistance level, followed by a rebound that saw the week close near 158,500. The current price (158,496) sits right at the lower end of the resistance zone, just below the 159,000 level, suggesting that the market is testing whether the former resistance will now turn into new support.
What’s next for the couple?
The balance of risks remains uncertain, but for the time being it may appear to be tilted slightly towards gains as long as tensions surrounding the US–Iran conflict and the Strait of Hormuz persist, which is keeping bond yields higher (10-year US bonds are still around 4.655 per cent). At the same time, the risk of another joint US–Japan intervention is likely to cap gains around the 160 level, whilst a significantly weaker CPI reading could pave the way for a decline to the 155–156 range, where investors have previously been keen to buy on dips. Wednesday’s CPI reading for July (forecast at 3.4% y/y, down from 3.5% previously) will be a key test for the pair’s future direction, as it will determine whether the market will continue to scale back expectations of a Fed rate rise in September and reverse the trend, or whether the current narrative will prevail.