S&P 500 — US Large Cap Index
 FTSE 100 — UK Blue Chips
 Euro Stoxx 50 — Eurozone Leaders
 DAX 40 — German Equities
 CAC 40 — French Market Index
 Nikkei 225 — Japan Benchmark
 Hang Seng — Hong Kong Index
 Shanghai Composite — China Mainland
 ASX 200 — Australian Market
 TSX Composite — Canada Index
 Nifty 50 — India Large Cap
 STI Index — Singapore Market
 KOSPI — South Korea Index
 Bovespa — Brazil Equities
 JSE Top 40 — South Africa Index
 IPC Index — Mexico Market

Key takeaways
- What is the technical outlook for EURGBP, EURAUD, and AUDUSD?
The Overbalance analysis aims to identify three financial instruments, analyzed primarily on the daily/four-hour (D1/H4) timeframe. The analysis uses only the Overbalance methodology, which helps determine where a trend may continue or where it may reverse. Today’s analysis covers three instruments, evaluated solely in terms of 1:1 correction structures. EURGBP From March 20 through the end of the month, EURGBP traded in an uptrend, but the subsequent correction turned into a stronger downtrend. After the 1:1 upward pattern was negated at the 0.8693 level, the declines accelerated. Currently, the 0.8693–0.8688 zone represents key resistance. Only a return of the price above this zone could shift the balance of power on the chart. For now, the base scenario remains a decline toward the lows at 0.8617.
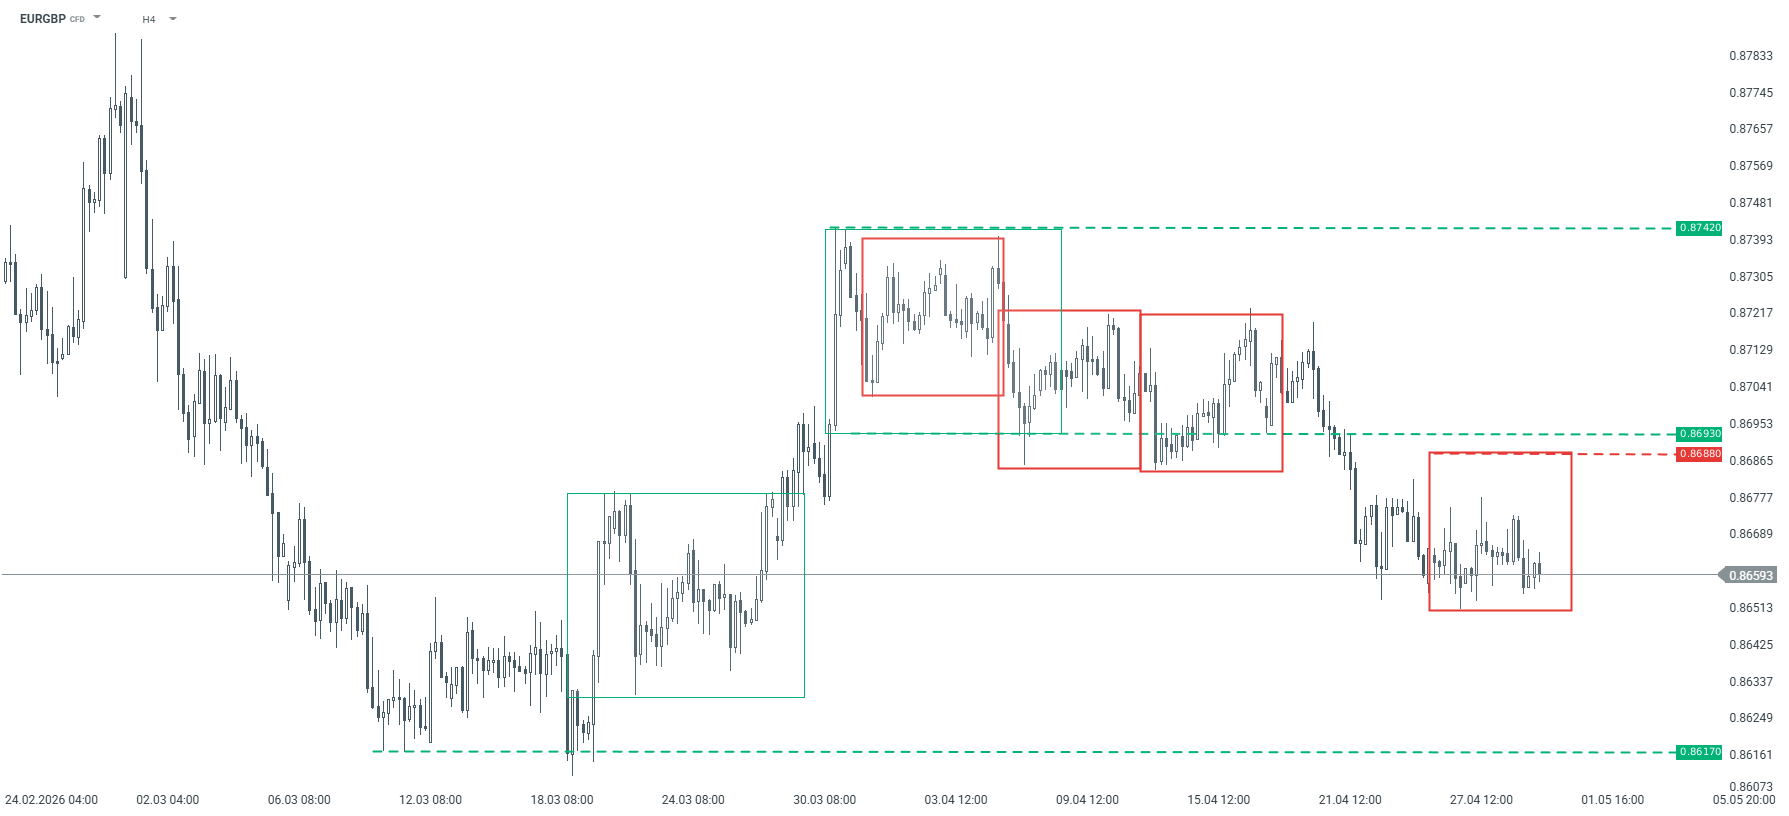
EURGBP – H4 timeframe. Source: xStation EURAUD From March 11 through the end of the month, the EURAUD pair was in an uptrend; however, the largest corrective pattern was subsequently negated at the 1.6680 level, which was then tested from the opposite side. Since then, we have observed the development of a downtrend. The largest current corrective pattern (marked in red) defines a key resistance level at 1.6470. According to the Overbalance methodology, as long as the price remains below this level, the downtrend remains in effect.
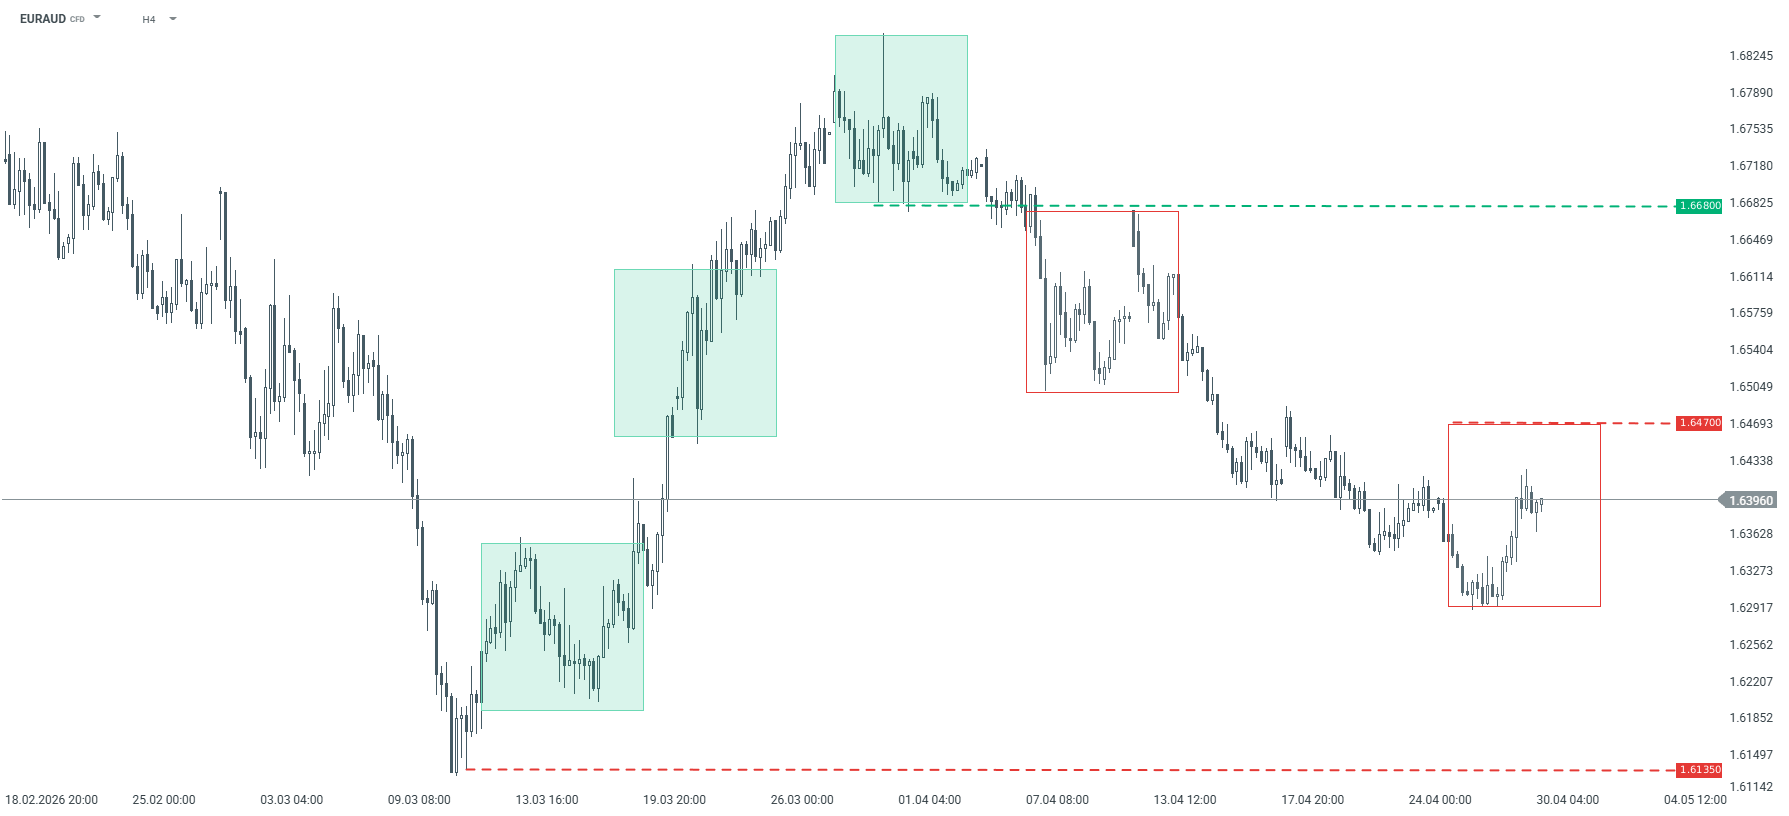
EURAUD – H4 timeframe. Source: xStation AUDUSD Since late March, the AUDUSD pair has been in an uptrend. Recently, the exchange rate has twice tested support at the 0.7015 level, which corresponds to the lower boundary of the 1:1 pattern. As long as this level holds, the uptrend remains intact. It is worth noting, however, that another test of this zone could weaken it, increasing the risk of it being broken and thus triggering a larger downward correction.
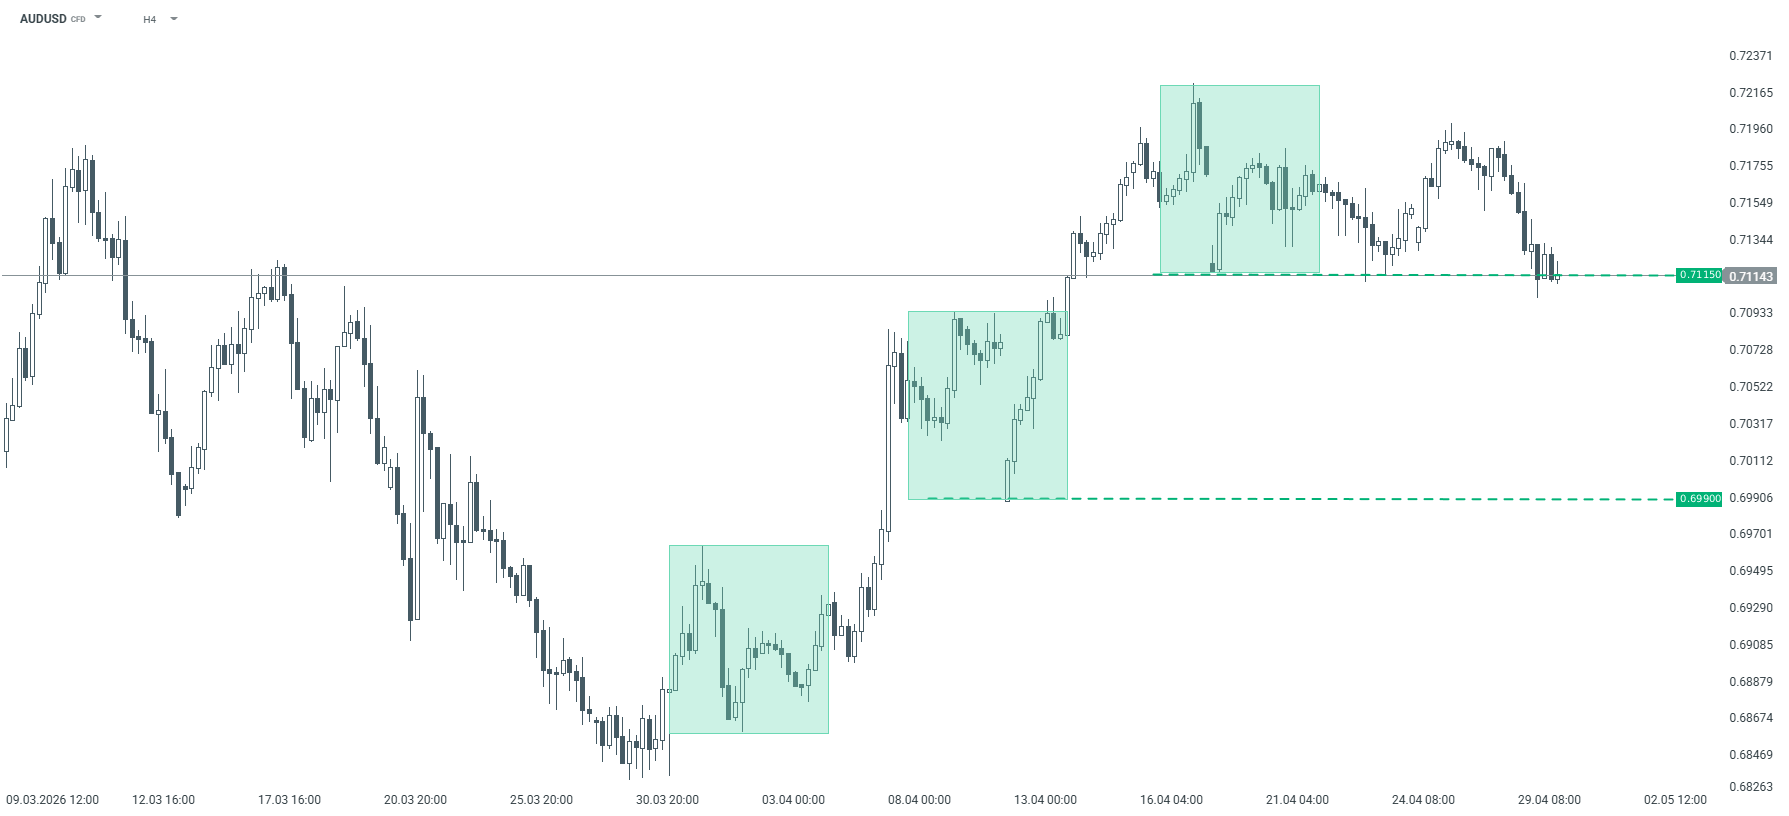
AUDUSD – H4 chart. Source: xStation