S&P 500 — US Large Cap Index
 FTSE 100 — UK Blue Chips
 Euro Stoxx 50 — Eurozone Leaders
 DAX 40 — German Equities
 CAC 40 — French Market Index
 Nikkei 225 — Japan Benchmark
 Hang Seng — Hong Kong Index
 Shanghai Composite — China Mainland
 ASX 200 — Australian Market
 TSX Composite — Canada Index
 Nifty 50 — India Large Cap
 STI Index — Singapore Market
 KOSPI — South Korea Index
 Bovespa — Brazil Equities
 JSE Top 40 — South Africa Index
 IPC Index — Mexico Market

(D1/H4) time frame. The analysis uses only the Overbalance methodology, which helps identify points where a trend may continue or where a trend reversal may occur.
GBPUSD
GBPUSD has been trending upward for quite some time, but recently we have seen a marked deepening of the downward correction. After reaching a high around 1.3660, the price began to pull back and subsequently broke below the 1.3392 level, which served as the lower boundary of a broad 1:1 green pattern. After breaking through this level, the correction continued to develop, and currently, the key resistance level remains at 1.3295, which corresponds to the upper boundary of the local 1:1 pattern marked in red. As long as the price remains below this level, the downtrend remains in effect. Conversely, a move back above 1.3295, followed by a move above 1.3392, would increase the likelihood of a return to an uptrend. At this point, however, a return to an uptrend is not the base case scenario. Should the declines continue to deepen, the next significant level remains around 1.3140—the recent lows.
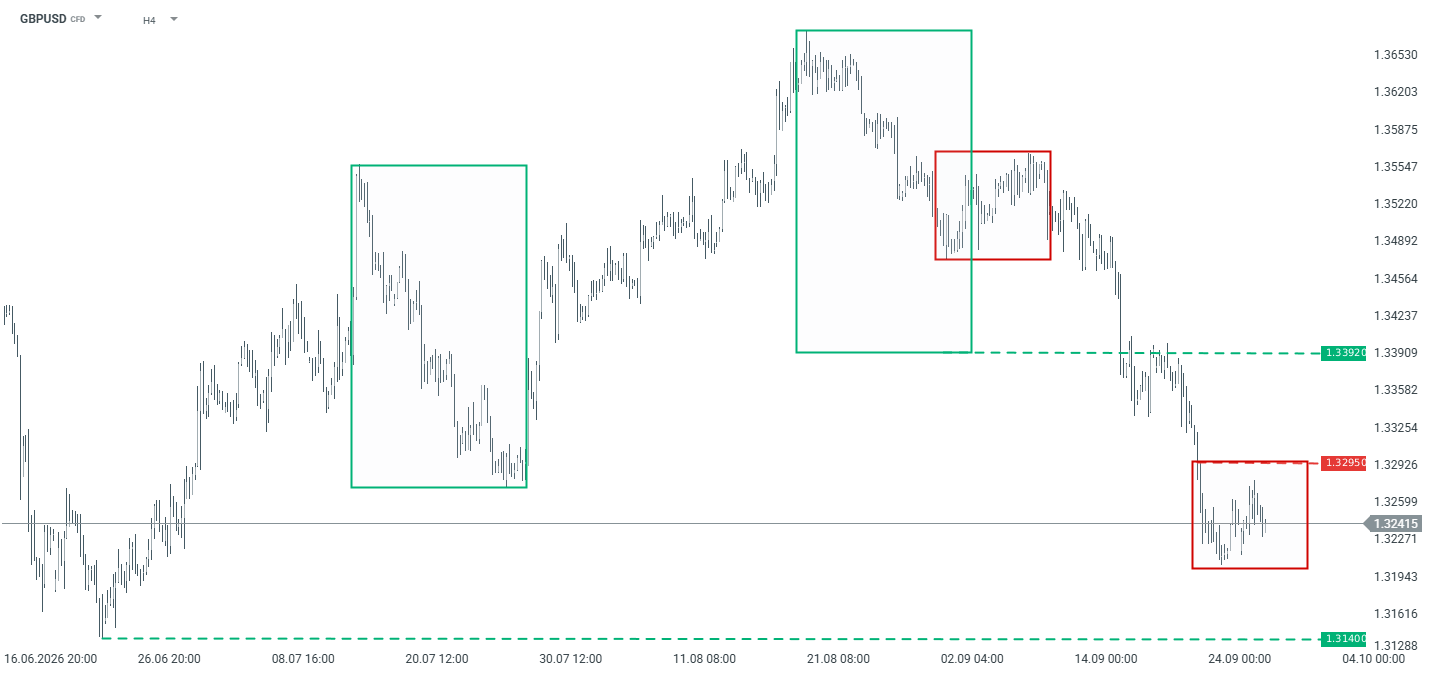
GBPUSD – H4 timeframe. Source: xStation5
EURAUD
The EURAUD pair has been trending downward for quite some time. Following an earlier downward move, the price has recently been attempting to rebound, but it remains within a broad downtrend. Currently, the key resistance level is 1.6323, which marks the upper boundary of the 1:1 pattern highlighted in red. As long as the price remains below this level, the downtrend remains in effect. Conversely, a sustained break above 1.6323 could pave the way for a further upward correction. In the event of a return to declines, the key support level remains at 1.6063, the recent low
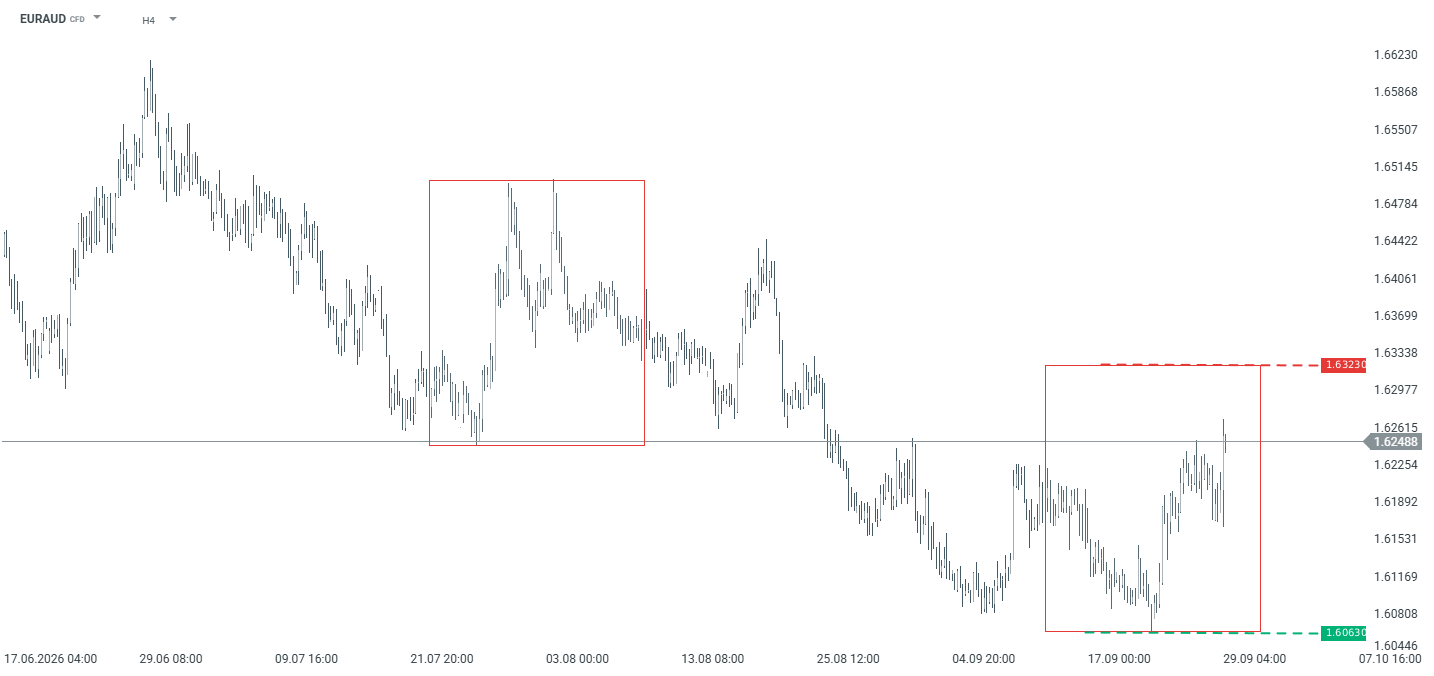
EURAUD – H4 timeframe. Source: xStation5
EURGBP
The EURGBP pair has been trending downward for quite some time, but since early July, we’ve seen an attempt at a more significant rebound. After hitting a low around 0.8463, the price began an upward move, but it remains within a broad 1:1 red pattern. The key resistance level remains at 0.8630, where the upper boundary of this pattern is located. As long as the price stays below this level, the downtrend remains in effect. Conversely, the nearest support level remains at 0.8553, where the lower boundary of the local green 1:1 pattern is located. If this level holds, a further upward correction is possible. Conversely, a break below it would increase the risk of a return to downward movement.
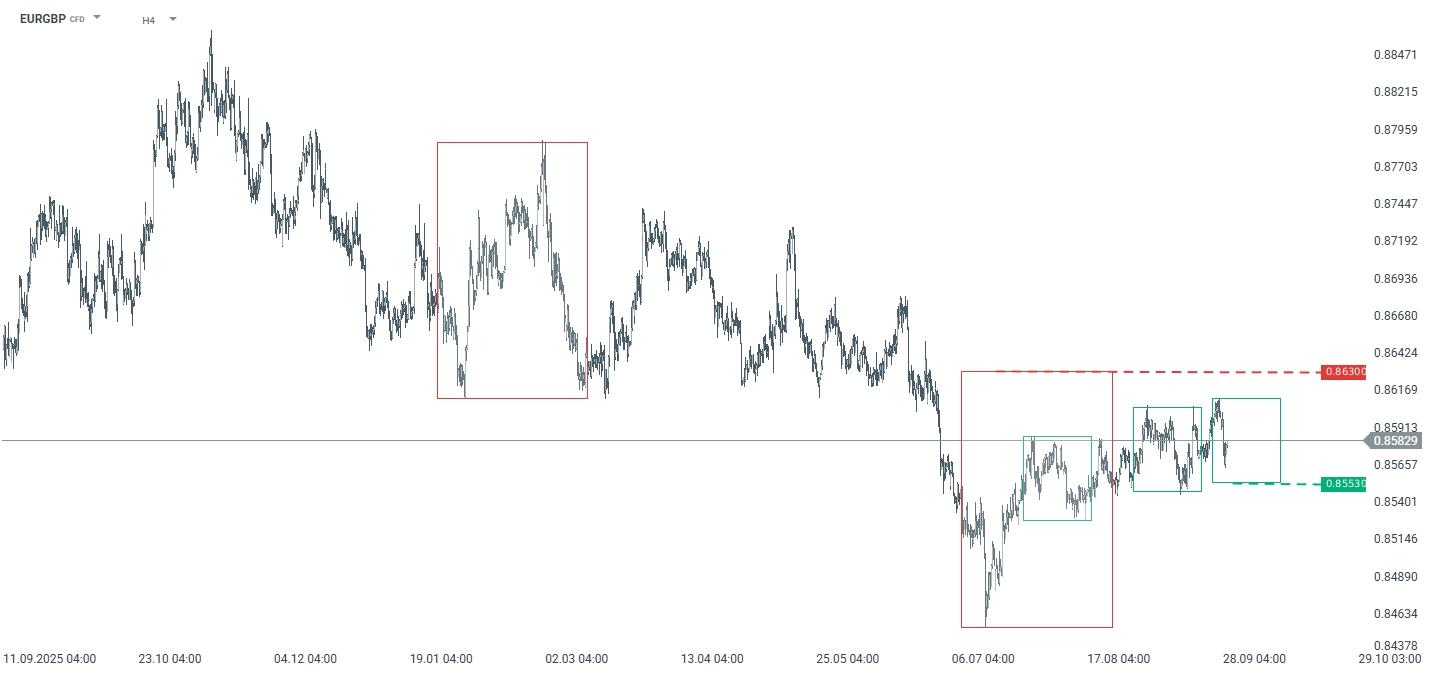
EURGBP – H4 timeframe. Source: xStation5