S&P 500 — US Large Cap Index
 FTSE 100 — UK Blue Chips
 Euro Stoxx 50 — Eurozone Leaders
 DAX 40 — German Equities
 CAC 40 — French Market Index
 Nikkei 225 — Japan Benchmark
 Hang Seng — Hong Kong Index
 Shanghai Composite — China Mainland
 ASX 200 — Australian Market
 TSX Composite — Canada Index
 Nifty 50 — India Large Cap
 STI Index — Singapore Market
 KOSPI — South Korea Index
 Bovespa — Brazil Equities
 JSE Top 40 — South Africa Index
 IPC Index — Mexico Market

Key takeaways
- What is the technical outlook for USDCAD, NZDUSD, and EURNZD?
This analysis from the Overbalance series aims to identify three financial instruments, analysed primarily on the daily/four-hour (D1/H4) timeframe. The analysis utilises only the Overbalance methodology, which helps to identify points where a trend may continue or where a reversal may occur. Today’s analysis covers three instruments, assessed solely in terms of 1:1 correction structures.
USDCAD
USDCAD prices have been on a downward trend since the beginning of April. The chart shows a 1:1 pattern with a range of around 80 pips. Although the latest pattern has been slightly breached, the price has not exceeded the 127.2% level, which, according to the Overbalance methodology, indicates that the downward trend remains intact. The current correction has stalled around 1.3630, where the upper boundary of the 1:1 pattern is located. Until this level is broken, the scenario of further declines remains in place.
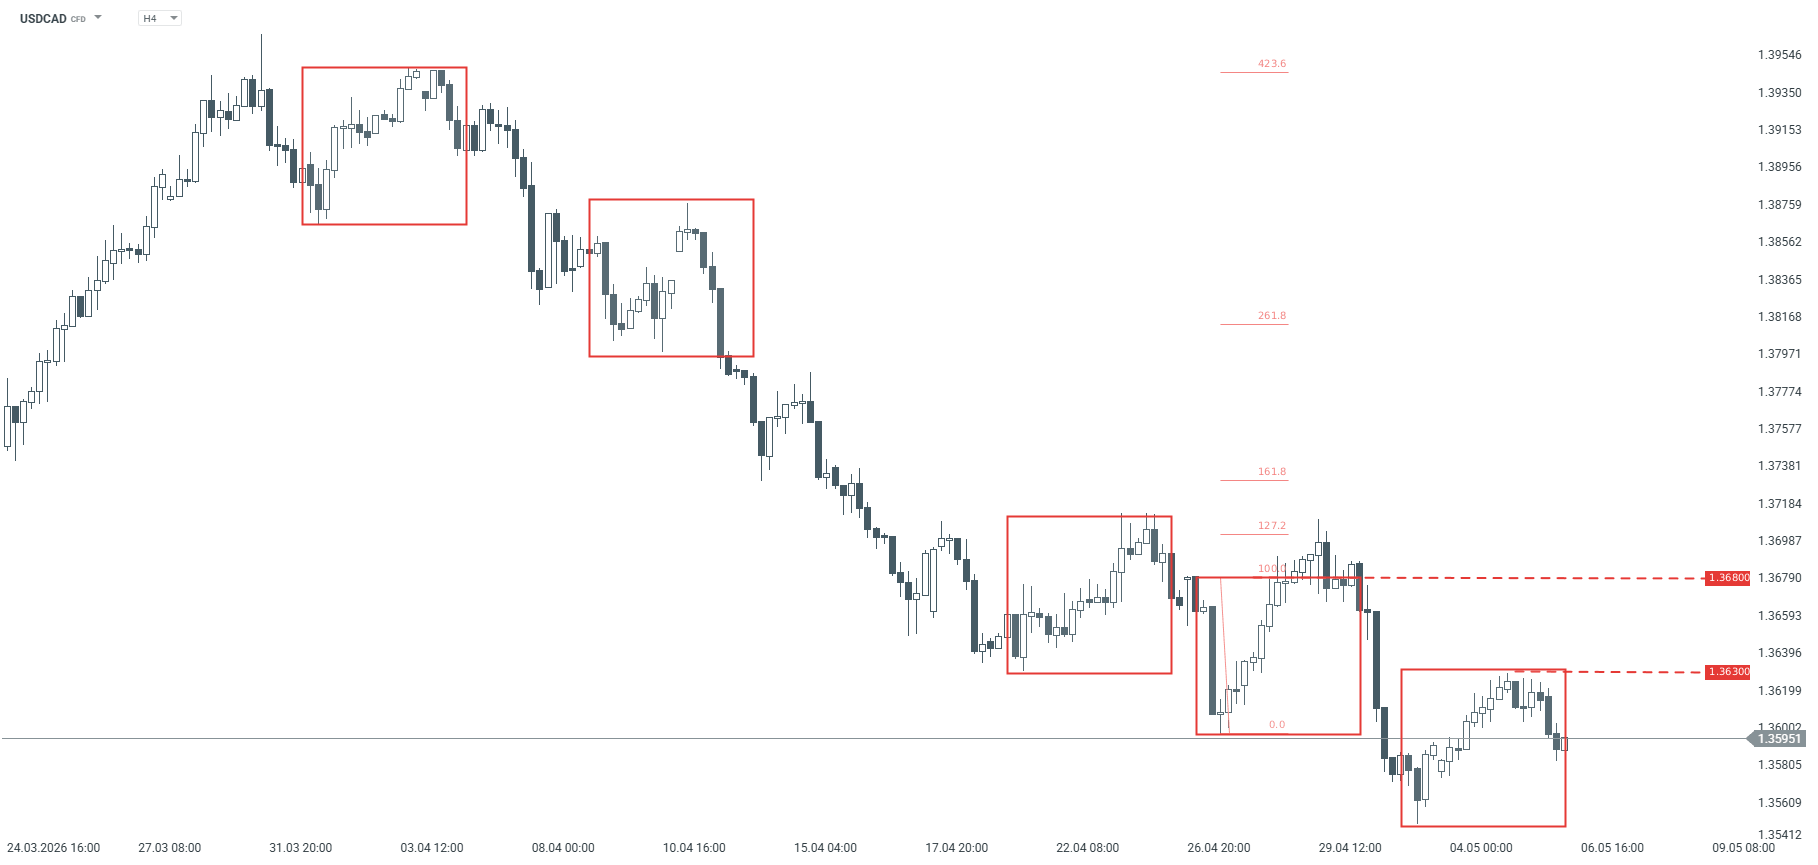
USDCAD – H4 timeframe. Source: xStation
NZDUSD
Since 6 April, NZDUSD has been trading within a local uptrend. The lower boundary of the pattern at 0.5840 has recently been tested twice. This level was only slightly breached, but the price failed to return below the polarity of the previously negated downward pattern at 0.5828, which led to the emergence of another upward impulse. According to the Overbalance methodology, the uptrend remains in place, and the key support level remains at 0.5865, derived from the lower boundary of the green 1:1 pattern. The pattern remains valid as it has only been slightly breached but not negated.
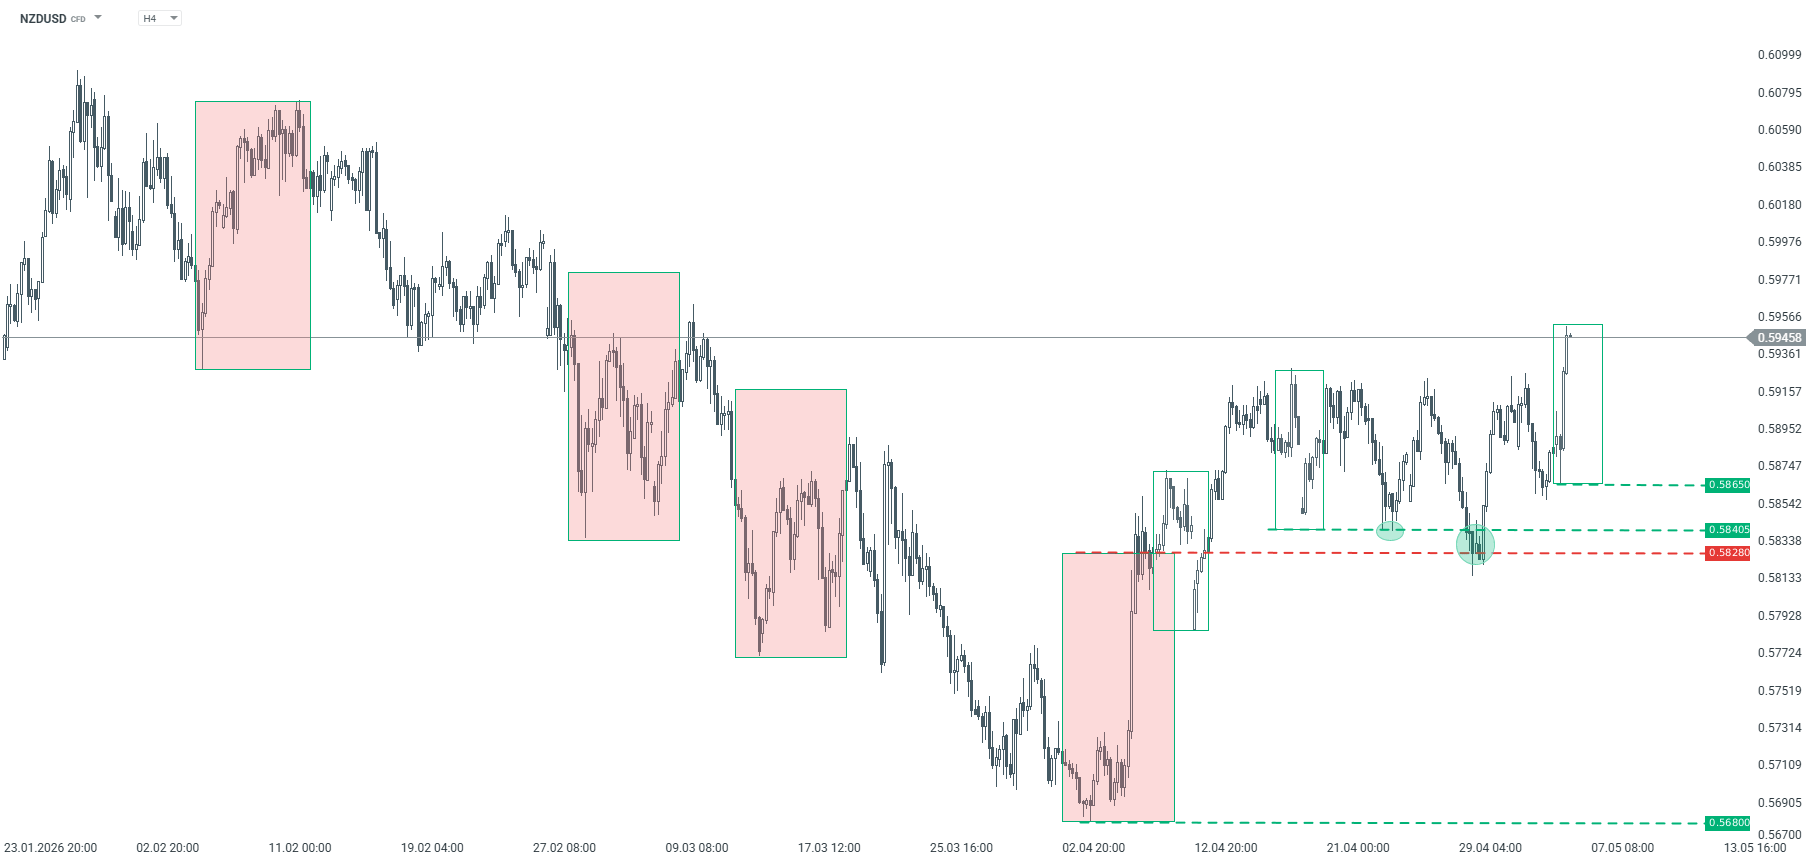
NZDUSD – H4 chart. Source: xStation
EURNZD
Since 7 April, the EURNZD has been trading in a downtrend. The price attempted to break through the support level at 1.9969 on several occasions and eventually both broke through it and negated the 1:1 upward trend, confirming the bearish scenario. In the event of a correction, the key short-term resistance remains at 1.9930. If the downward movement continues, the lows from February and March at 1.9540 remain a potential target for selling.
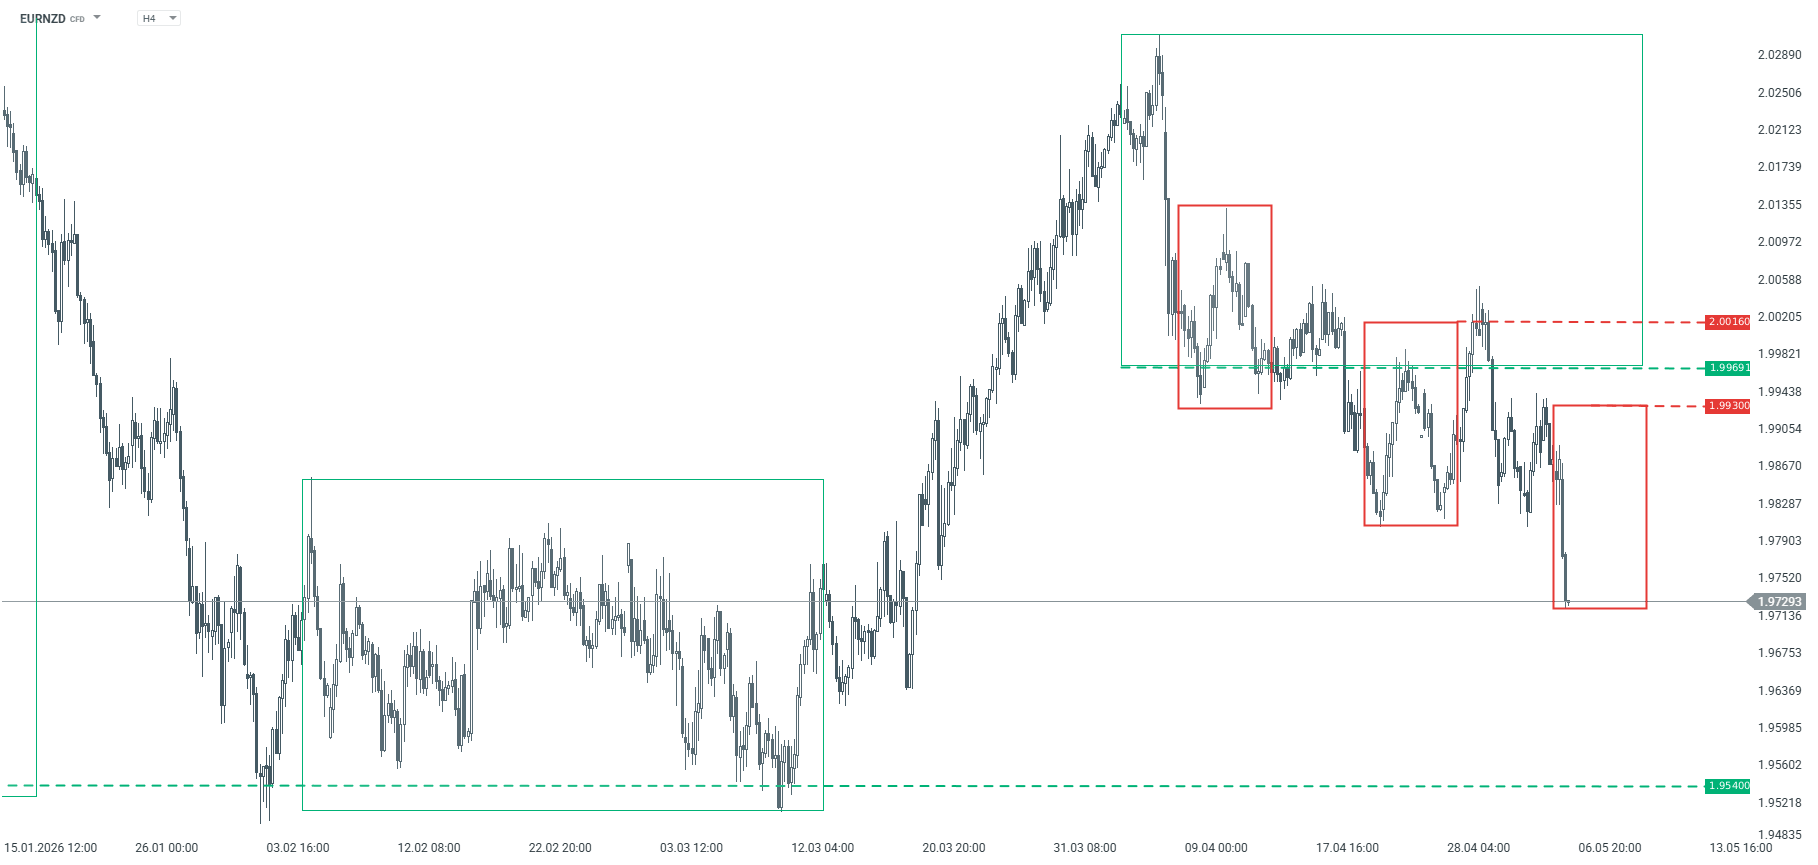
EURNZD – H4 chart. Source: xStation