S&P 500 — US Large Cap Index
 FTSE 100 — UK Blue Chips
 Euro Stoxx 50 — Eurozone Leaders
 DAX 40 — German Equities
 CAC 40 — French Market Index
 Nikkei 225 — Japan Benchmark
 Hang Seng — Hong Kong Index
 Shanghai Composite — China Mainland
 ASX 200 — Australian Market
 TSX Composite — Canada Index
 Nifty 50 — India Large Cap
 STI Index — Singapore Market
 KOSPI — South Korea Index
 Bovespa — Brazil Equities
 JSE Top 40 — South Africa Index
 IPC Index — Mexico Market

- XRP remains under pressure, gravitating toward key psychological support at $1.00 after falling 1.71% the previous day.
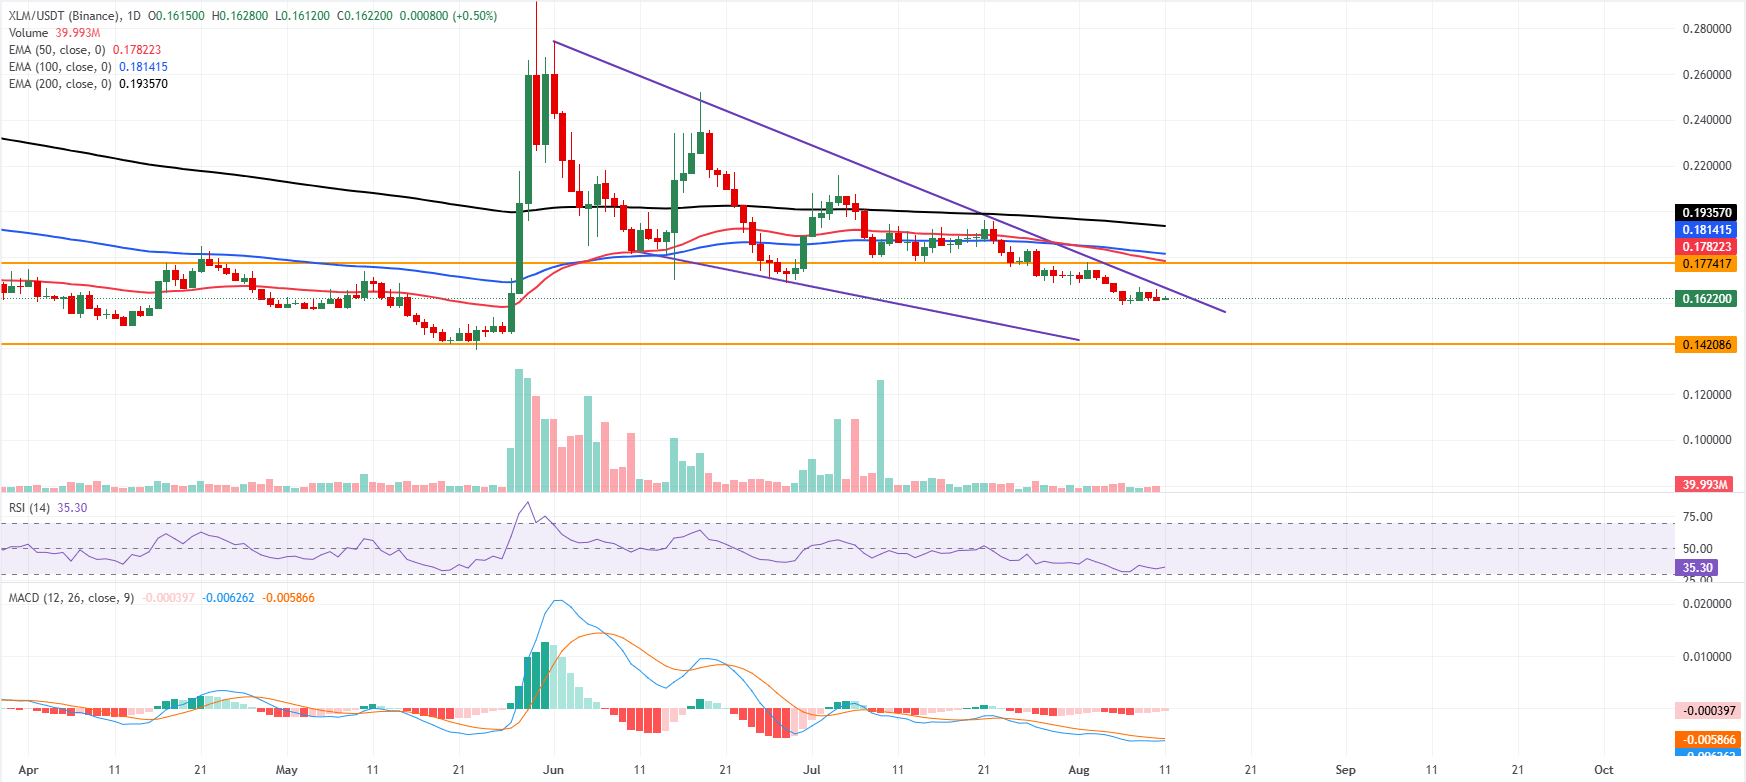
- XLM is trading at $0.162, extending its decline below the short- and medium-term EMAs.
- Derivatives metrics support a bearish bias, hinting at further correction for both altcoins.
Ripple (XRP) and Stellar (XLM) remain under pressure on Tuesday after falling slightly the previous day. XRP gravitates toward the key $1.00 psychological level while XLM slips below the critical support zone. Weakening derivatives metrics for both altcoins cap recovery outlook.
Derivatives metrics show a bearish bias
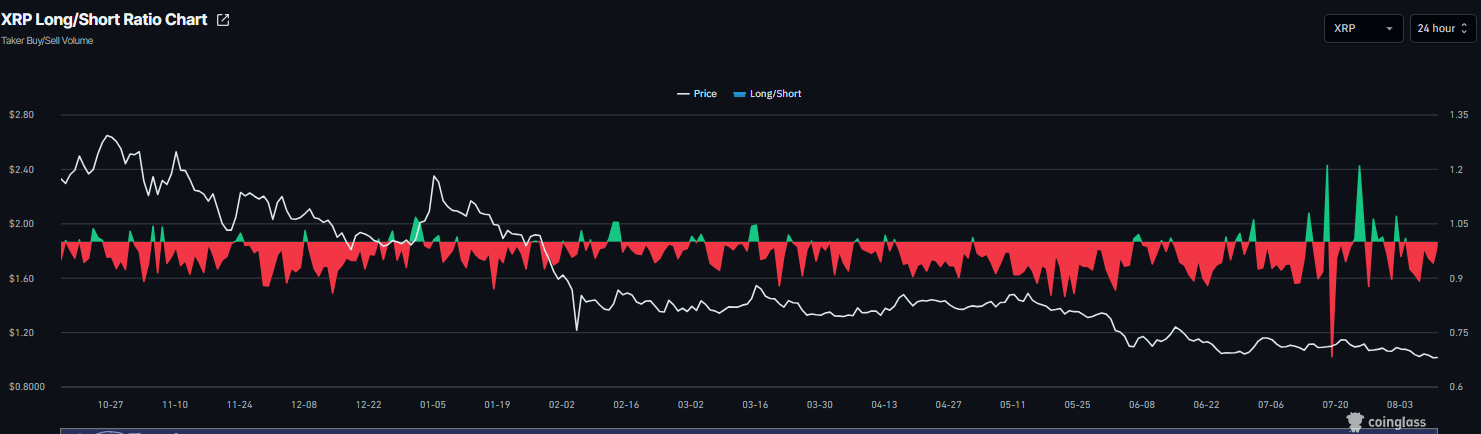
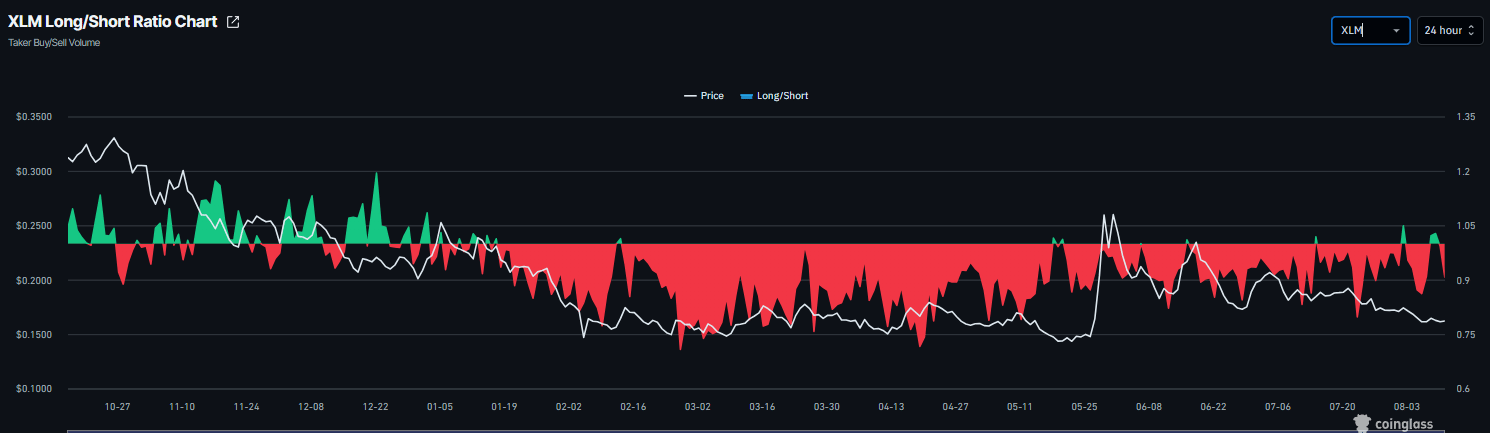
Derivatives data shows a bearish bias among traders. CoinGlass’ long-to-short ratios for XRP and XLM read 0.94 and 0.90, respectively, on Tuesday and is nearing the lowest level over a month. A ratio below one indicates bearish sentiment, as traders are betting the asset prices will fall.
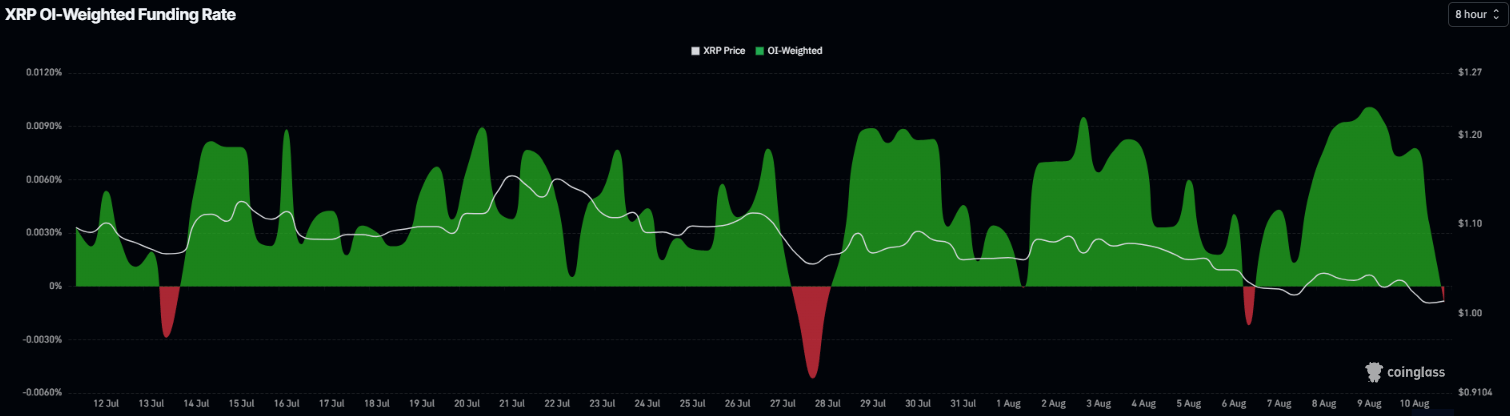
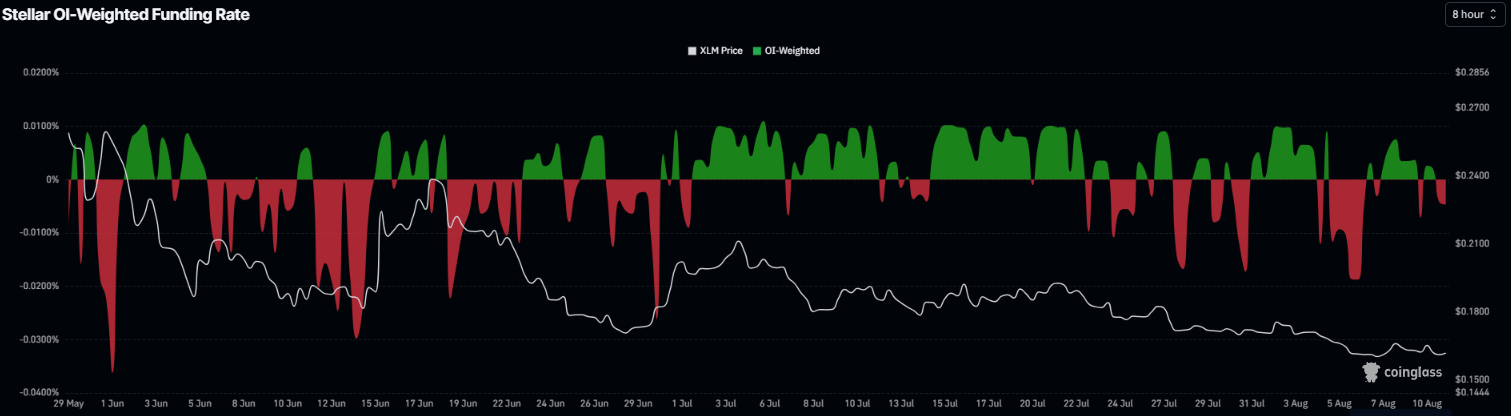
In addition, the funding rate for XRP dipped negative on Tuesday while the XLM rate flipped negative on Monday. For both altcoins, the rates read -0.0009% and -0.0047%, respectively, on Tuesday. These negative rates indicate that short traders are paying longs and reflect a bearish bias.
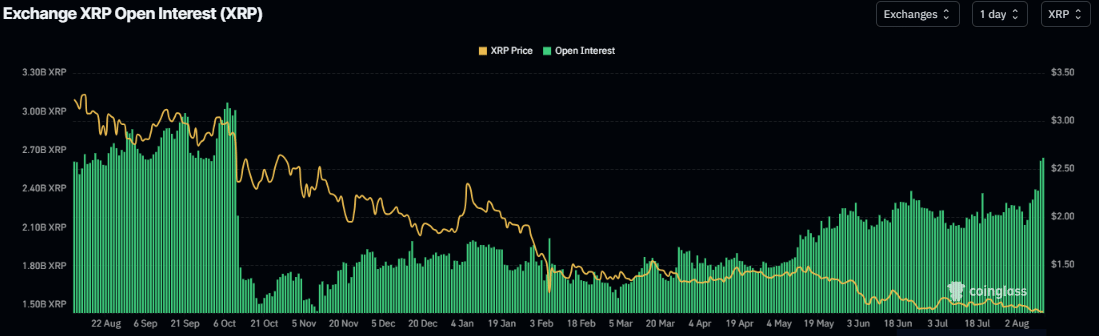
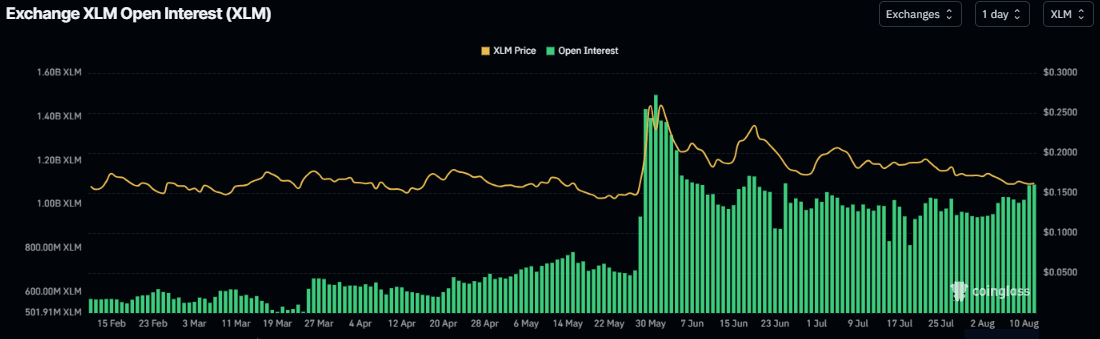
CoinGlass’ Open Interest (OI) across exchanges chart for XRP and XLM has been rising since early August, with outstanding contracts reaching 2.64 billion XRP coins and 1.09 billion XLM coins on Tuesday. The increase in OI alongside falling prices suggests that new short positions are entering the market, signaling a bearish outlook and raising the risk of further correction in XRP and XLM.
XRP technical outlook: Gravitates toward the key $1 psychological level
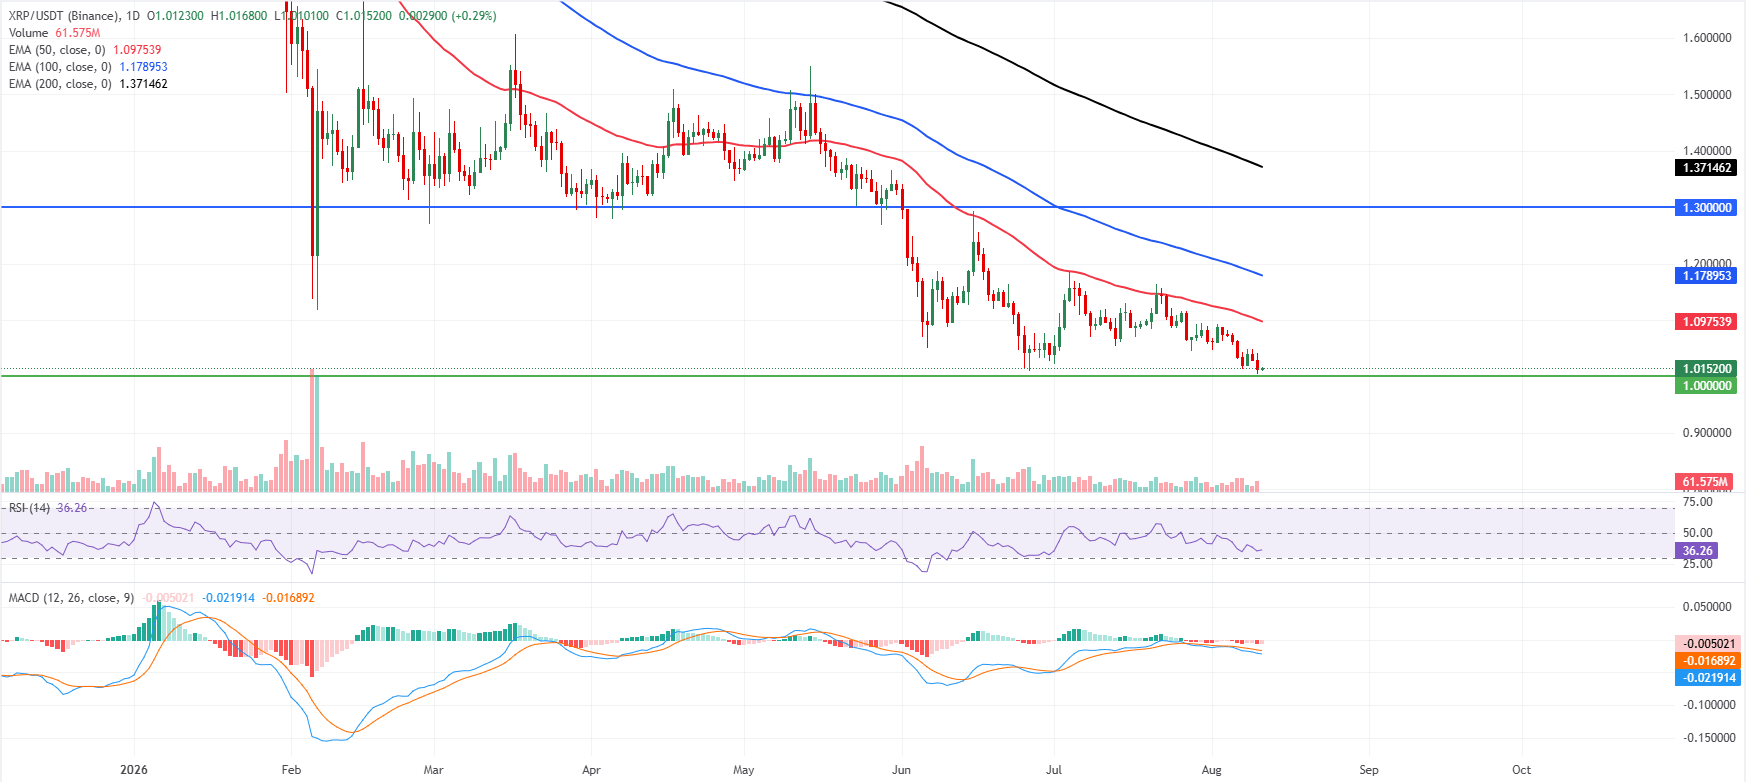
XRP price trades at $1.015 on Tuesday, extending a bearish near-term tone as price holds beneath the 50-day Exponential Moving Average (EMA) at $1.097, the 100-day EMA at $1.178 and the 200-day EMA at $1.371. This alignment of key EMAs above the market suggests persistent downside pressure. At the same time, the Relative Strength Index (RSI) at 36 remains below the midline, hinting at weak demand rather than outright oversold conditions. The Moving Average Convergence Divergence (MACD) is negative with the indicator staying below the zero line, reinforcing the view that any bounces are likely corrective within a broader capped structure.
On the downside, immediate support is located at the horizontal level near $1.000, where buyers could attempt to slow the decline.
On the topside, initial resistance appears at the 50-day EMA clustered around $1.097, followed by the 100-day EMA at $1.178 and the horizontal barrier at $1.300. Beyond these, the 200-day EMA at $1.371 and the more distant resistance line at $1.900 define a wider ceiling that XRP would need to reclaim to neutralize the current bearish bias.
XLM technical outlook: Bears in control
XLM price trades at $0.162 on Tuesday, extending its retreat below the short- and medium-term EMAs, which keeps the near-term bias bearish. XLM remains capped beneath the downward trendline break level at $0.166, while the RSI around 35 hints at persistent weak momentum but not yet extreme oversold conditions. The MACD indicator stays in negative territory, reinforcing a downside-skewed structure as price consolidates under the key EMA cluster.
On the topside, initial resistance is located at the reclaimed trendline break area near $0.166, followed by the horizontal barrier at $0.177, with the 50-day EMA at $0.178 and the 100-day EMA at $0.181 forming a dense supply zone above. Further up, the 200-day EMA at $0.193 marks a broader bearish pivot.
On the downside, the next significant support stands at the horizontal level of $0.142, and a clear break toward this floor would likely open room for an extension of the current downtrend before any meaningful base-building attempt emerges.