S&P 500 — US Large Cap Index
 FTSE 100 — UK Blue Chips
 Euro Stoxx 50 — Eurozone Leaders
 DAX 40 — German Equities
 CAC 40 — French Market Index
 Nikkei 225 — Japan Benchmark
 Hang Seng — Hong Kong Index
 Shanghai Composite — China Mainland
 ASX 200 — Australian Market
 TSX Composite — Canada Index
 Nifty 50 — India Large Cap
 STI Index — Singapore Market
 KOSPI — South Korea Index
 Bovespa — Brazil Equities
 JSE Top 40 — South Africa Index
 IPC Index — Mexico Market
- Solana trades above $78 on Thursday, gaining nearly 10% so far this week.
- Derivatives data backs the bullish bias, with long positions climbing to a monthly high and funding rates turning positive.
- Mild ETF inflows on Wednesday, alongside bullish momentum indicators, support further gains in SOL.
Solana (SOL) extends its recovery, trading above $78 on Thursday, having gained nearly 10% so far this week. The rebound is supported by strengthening derivatives metrics, modest institutional demand and improving technical momentum, all suggesting SOL could extend its gains in the near term.
Strengthening derivatives metrics
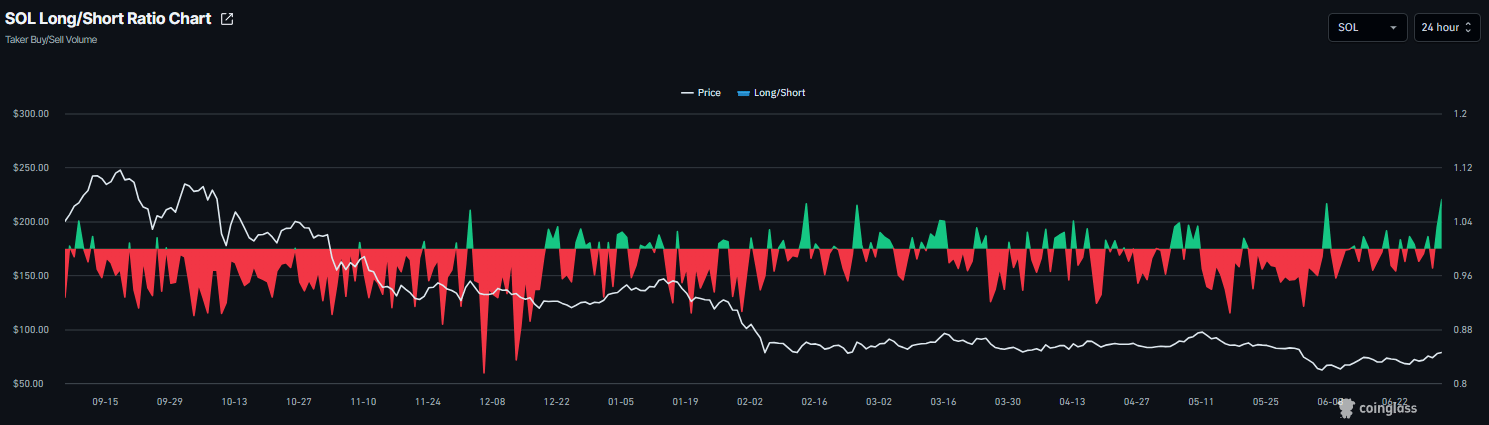
Derivatives data for Solana shows bullish bias. CoinGlass long-to-short ratio reads 1.11 on Thursday, the highest level over a month. A ratio above 1 indicates bullish sentiment, as traders bet that asset prices will rally.
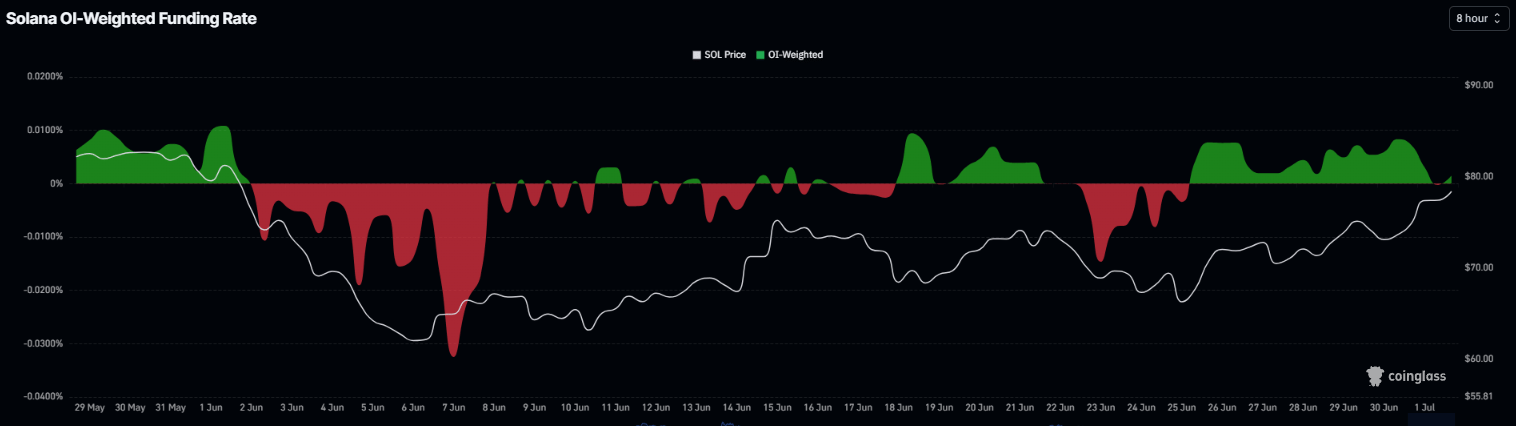
In addition, CoinGlass funding rate for SOL turned positive on Thursday, reading 0.0017%, indicating that longs are paying shorts and suggesting bullish sentiment.
Return of institutional demand
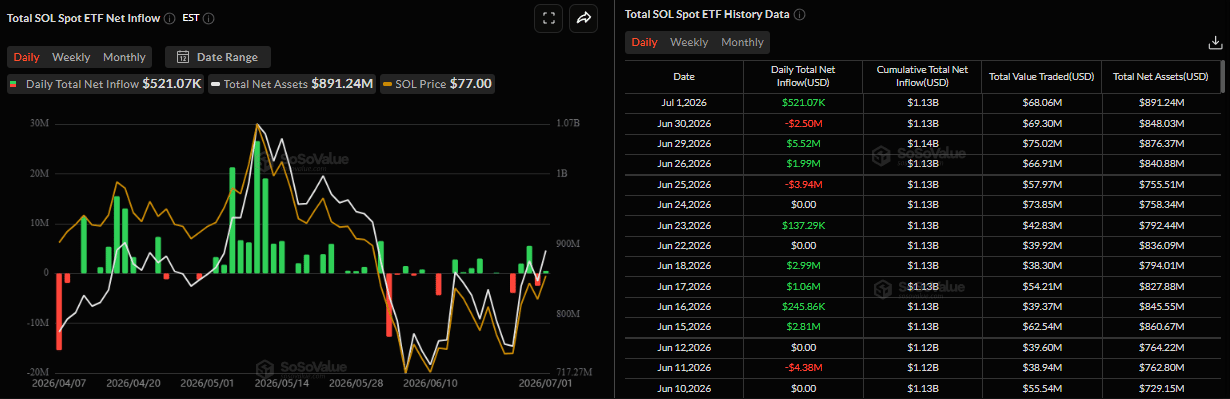
Institutional demand shows early signs of optimism. SoSoValue data shows that SOL’s spot ETFs recorded an inflow of $521,070 on Wednesday. So far through Wednesday, SOL recorded a net inflow of $3.55 million; if this inflow trend continues and intensifies this week, SOL price could see further upside.
Solana Price Forecast: Bullish strength gaining traction
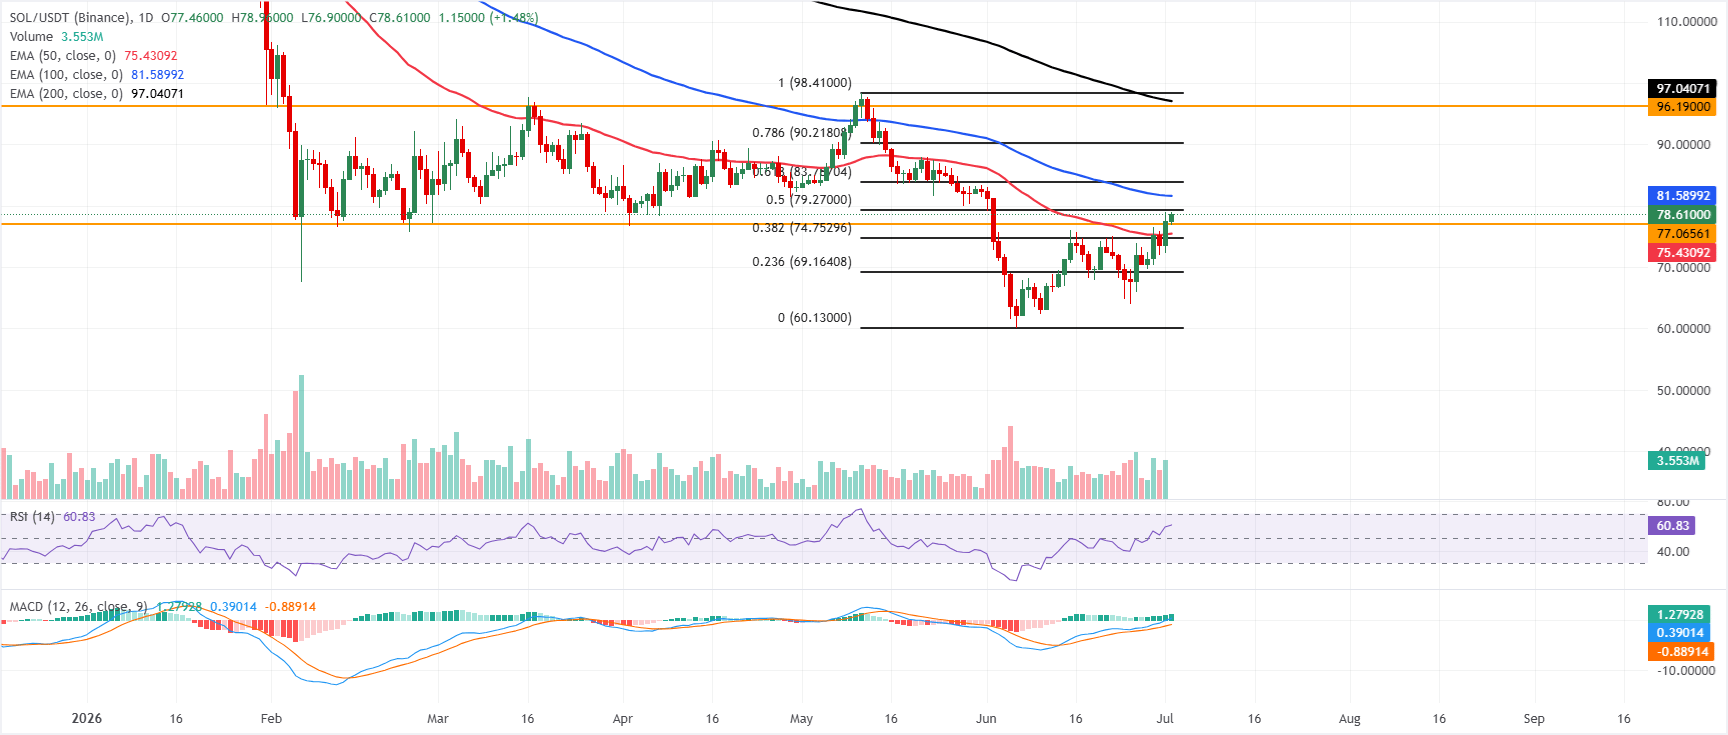
Solana price extends its gains, trading above $78 on Thursday after surging nearly 10% so far this week. However, SOL maintains a cautious tone, trading below the 100-day and 200-day Exponential Moving Averages (EMAs) at $81.58 and $97.04. Meanwhile, SOL holds above the 50-day EMA at $75.43, suggesting some underlying demand, but the 50% retracement of the latest downswing at $79.27 already acts as immediate overhead supply.
Momentum remains constructive, with the Relative Strength Index (RSI) at 60 and the Moving Average Convergence Divergence (MACD) in positive territory, hinting that while higher EMAs cap the broader trend, buyers retain short-term traction.
On the topside, initial resistance stands at the 50% retracement at $79.27, followed by the 100-day EMA at $81.58 and the 61.8% Fibonacci retracement at $83.79. Above these, a stronger barrier emerges at the 78.6% Fibonacci retracement near $90.22, ahead of the horizontal resistance at $96.19 and the 200-day EMA at $97.04.
On the downside, immediate support is seen at the horizontal level around $77.07, with the 50-day EMA at $75.43 and the 38.2% Fibonacci retracement at $74.75 forming a secondary demand zone; a deeper pullback would expose the 23.6% Fibonacci retracement at $69.16.