S&P 500 — US Large Cap Index
 FTSE 100 — UK Blue Chips
 Euro Stoxx 50 — Eurozone Leaders
 DAX 40 — German Equities
 CAC 40 — French Market Index
 Nikkei 225 — Japan Benchmark
 Hang Seng — Hong Kong Index
 Shanghai Composite — China Mainland
 ASX 200 — Australian Market
 TSX Composite — Canada Index
 Nifty 50 — India Large Cap
 STI Index — Singapore Market
 KOSPI — South Korea Index
 Bovespa — Brazil Equities
 JSE Top 40 — South Africa Index
 IPC Index — Mexico Market
Ethereum Price Forecast: ETH erases gains as market discounts weak jobs report


Ethereum price today: $2,670
- Ethereum declines below $2,700, erasing earlier gains after weaker-than-expected jobs data failed to lift market sentiment.
- ETH ETFs posted three straight days of outflows as selling dominance rises.
- ETH eyes the 20-day EMA after seeing a rejection near the $2,786 resistance.
Ethereum (ETH) briefly rose to $2,770 on Friday, its highest level in over a week, before easing down following a weak US jobs report for September.
Weak jobs and inflation print fails to lift market sentiment
The US Nonfarm payrolls (NFP) data for September showed the economy added 29,000 jobs, well below market expectations of 90,000, with the Unemployment Rate ticking up to 4.2%, slightly above forecasts.
Earlier in the week, the US PCE data for August also came in below market expectations, printing at 3.4% YoY, well below expectations of 3.7%.
The weak jobs data and inflation reading have crashed expectations of a rate hike in the Federal Reserve’s (Fed) October meeting to 23.8% at the time of writing, down from above 70% a few days earlier, according to the CME FedWatch Tool.
Despite declining rate-hike expectations, US 10-year note yields have remained strong. Yields initially declined to 5.15% in reaction to the weak jobs data but regained strength as the trading session unfolded and are back at 5.28%.
Prior to the data’s release, ETH rallied to $2,770, its highest level in a week but retraced shortly after the weak jobs data.
US spot ETH exchange-traded funds (ETFs) have posted three consecutive days of net outflows, totaling $117.7 million, per SoSoValue data.
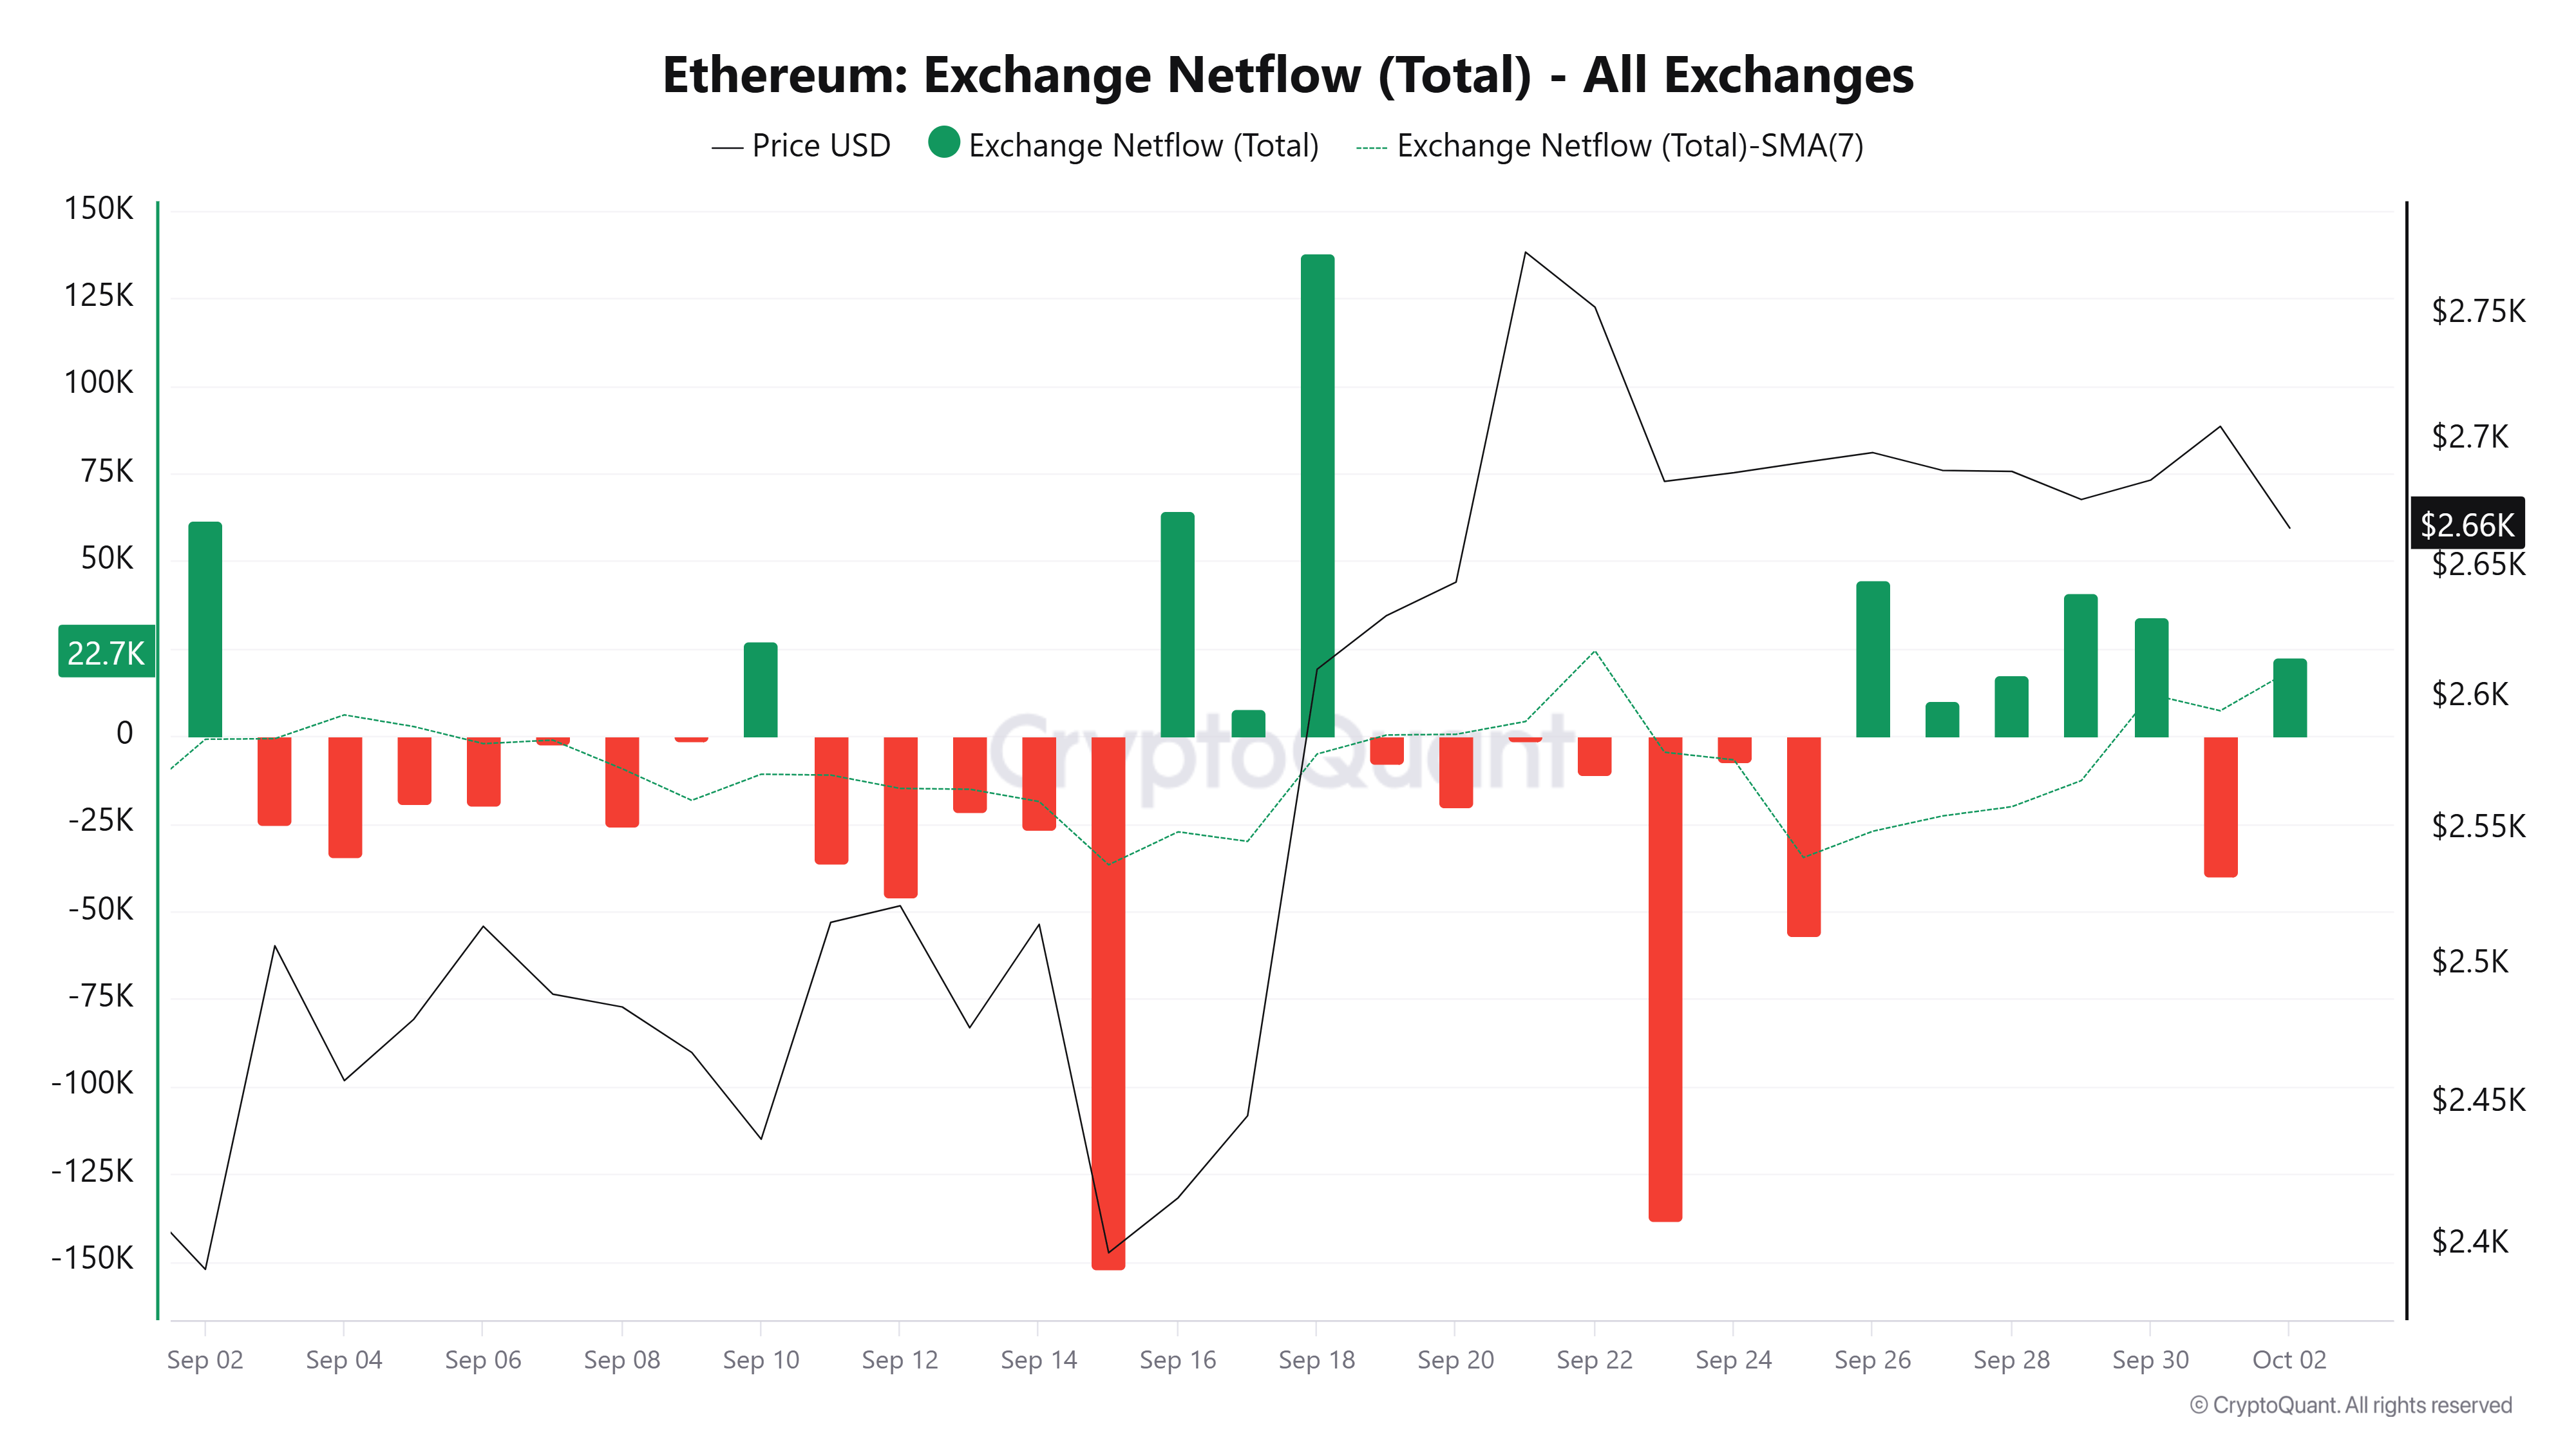
A similar trend is evident in ETH Exchange Netflows, which tracks the net difference between coins flowing in and out of exchanges.
Over the past seven days, deposits have outpaced withdrawals, with Thursday as the only outlier. Although modest, it shows traders are slightly leaning toward selling amid recent range-bound movements.
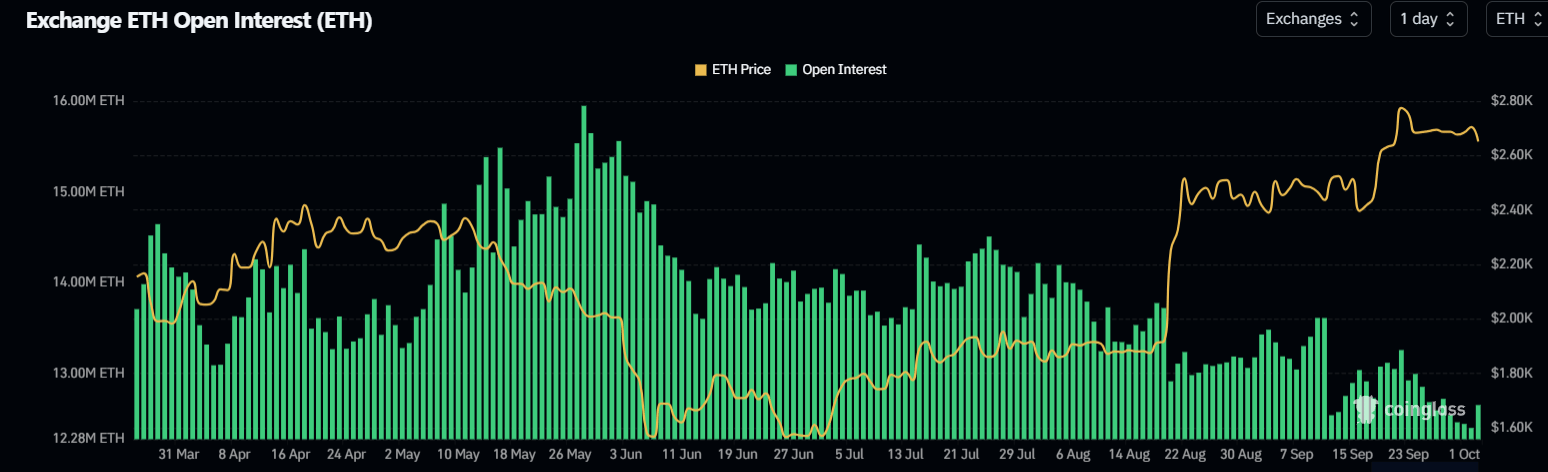
Meanwhile, open interest, which measures the total worth of outstanding contracts in a derivatives market, in the top altcoin increased by roughly 200K ETH over the past 24 hours. The rise comes after a steady decline over the past week.
Similarly, funding rates initially spiked to 0.009% but quickly eased to 0.002%.
Price action and moves across these key metrics indicate that market participants are discounting the impact of no rate hike this month.
Ethereum technical outlook: Rejection near $2,786 resistance brings 20-day EMA support in focus
Ethereum has recorded $127.2 million in liquidations over the past 24 hours, driven by $70.4 million in long liquidations, per Coinglass data.
On the daily chart, ETH is approaching the 20-day Exponential Moving Average (EMA) at $2,631 after suffering a rejection at the $2,86 resistance. The next support is seen at the $2,626 horizontal level, followed by $2,544 and then $2,431, where earlier demand aligns with the underlying EMA structure. Below these, deeper cushions emerge at $2,172 and $1,961.

On the topside, initial resistance stands at $2,786, ahead of a higher barrier at $2,880, with subsequent upside targets at $3,088 and $3,254 if the bullish pressure persists.
Momentum indicators, the Relative Strength Index (RSI) and Stochastic (Stoch), have dropped to 58 and 42, respectively, indicating fading bullish demand.