S&P 500 — US Large Cap Index
 FTSE 100 — UK Blue Chips
 Euro Stoxx 50 — Eurozone Leaders
 DAX 40 — German Equities
 CAC 40 — French Market Index
 Nikkei 225 — Japan Benchmark
 Hang Seng — Hong Kong Index
 Shanghai Composite — China Mainland
 ASX 200 — Australian Market
 TSX Composite — Canada Index
 Nifty 50 — India Large Cap
 STI Index — Singapore Market
 KOSPI — South Korea Index
 Bovespa — Brazil Equities
 JSE Top 40 — South Africa Index
 IPC Index — Mexico Market

- Bitcoin rises as bulls eye a short-term breakout above the $88,000-$90,000 supply range.
- Gold climbs and trades near $4,200 on Friday, but the recovery is still capped under a key moving-average cluster.
- US NFP rose by 29K in September, falling well short of the 90K market expectation.
The cryptocurrency market is widely recovering on Friday, with Bitcoin (BTC) trading above $86,000, up from the weekly low of $82,544. The Crypto King’s uptrend can be attributed to elevated investor interest, with modest capital flowing into spot Exchange-Traded Funds (ETFs).
Meanwhile, Gold (XAU/USD) holds onto an upward correction, while trading near $4,200. This marks the second straight day the metal has gained momentum, building on gradually improving market sentiment, particularly with reducing odds of an October interest rate hike.
US NFP falls short of market expectation
The United States (US) economy created fewer-than-expected jobs, totaling 29,000 in September, indicating a surprise softening of the labor market, according to the Bureau of Labor Statistics (BLS) report on Friday. The print missed the market expectation of 90,000 by a wide margin, not to mention the 133,000 increase in August, which was revised from 162,000.
Additional data from the report showed a modest uptick in the Unemployment Rate to 4.2%, alongside a rise in the Labor Force Participation Rate to 61.8% from 61.6%. Meanwhile, annual wage growth, tracked by Average Hourly Earnings, rose 3% annually, undershooting the consensus forecast of 3.2%.
Bitcoin remains elevated above $86,000 after the report, pointing to investor resilience despite the weaker September NFP. Gold, meanwhile, upholds a two-day recovery streak, seeking a sustained breakout above $4,200.
The odds of a Federal Reserve (Fed) rate hike in October continued to ease, averaging 18%, according to CME Group’s FedWatch tool. This means that market consensus is that the Fed will leave interest rates unchanged in the 3.75%-4.00% range, potentially relieving sell-side pressure for risk assets.
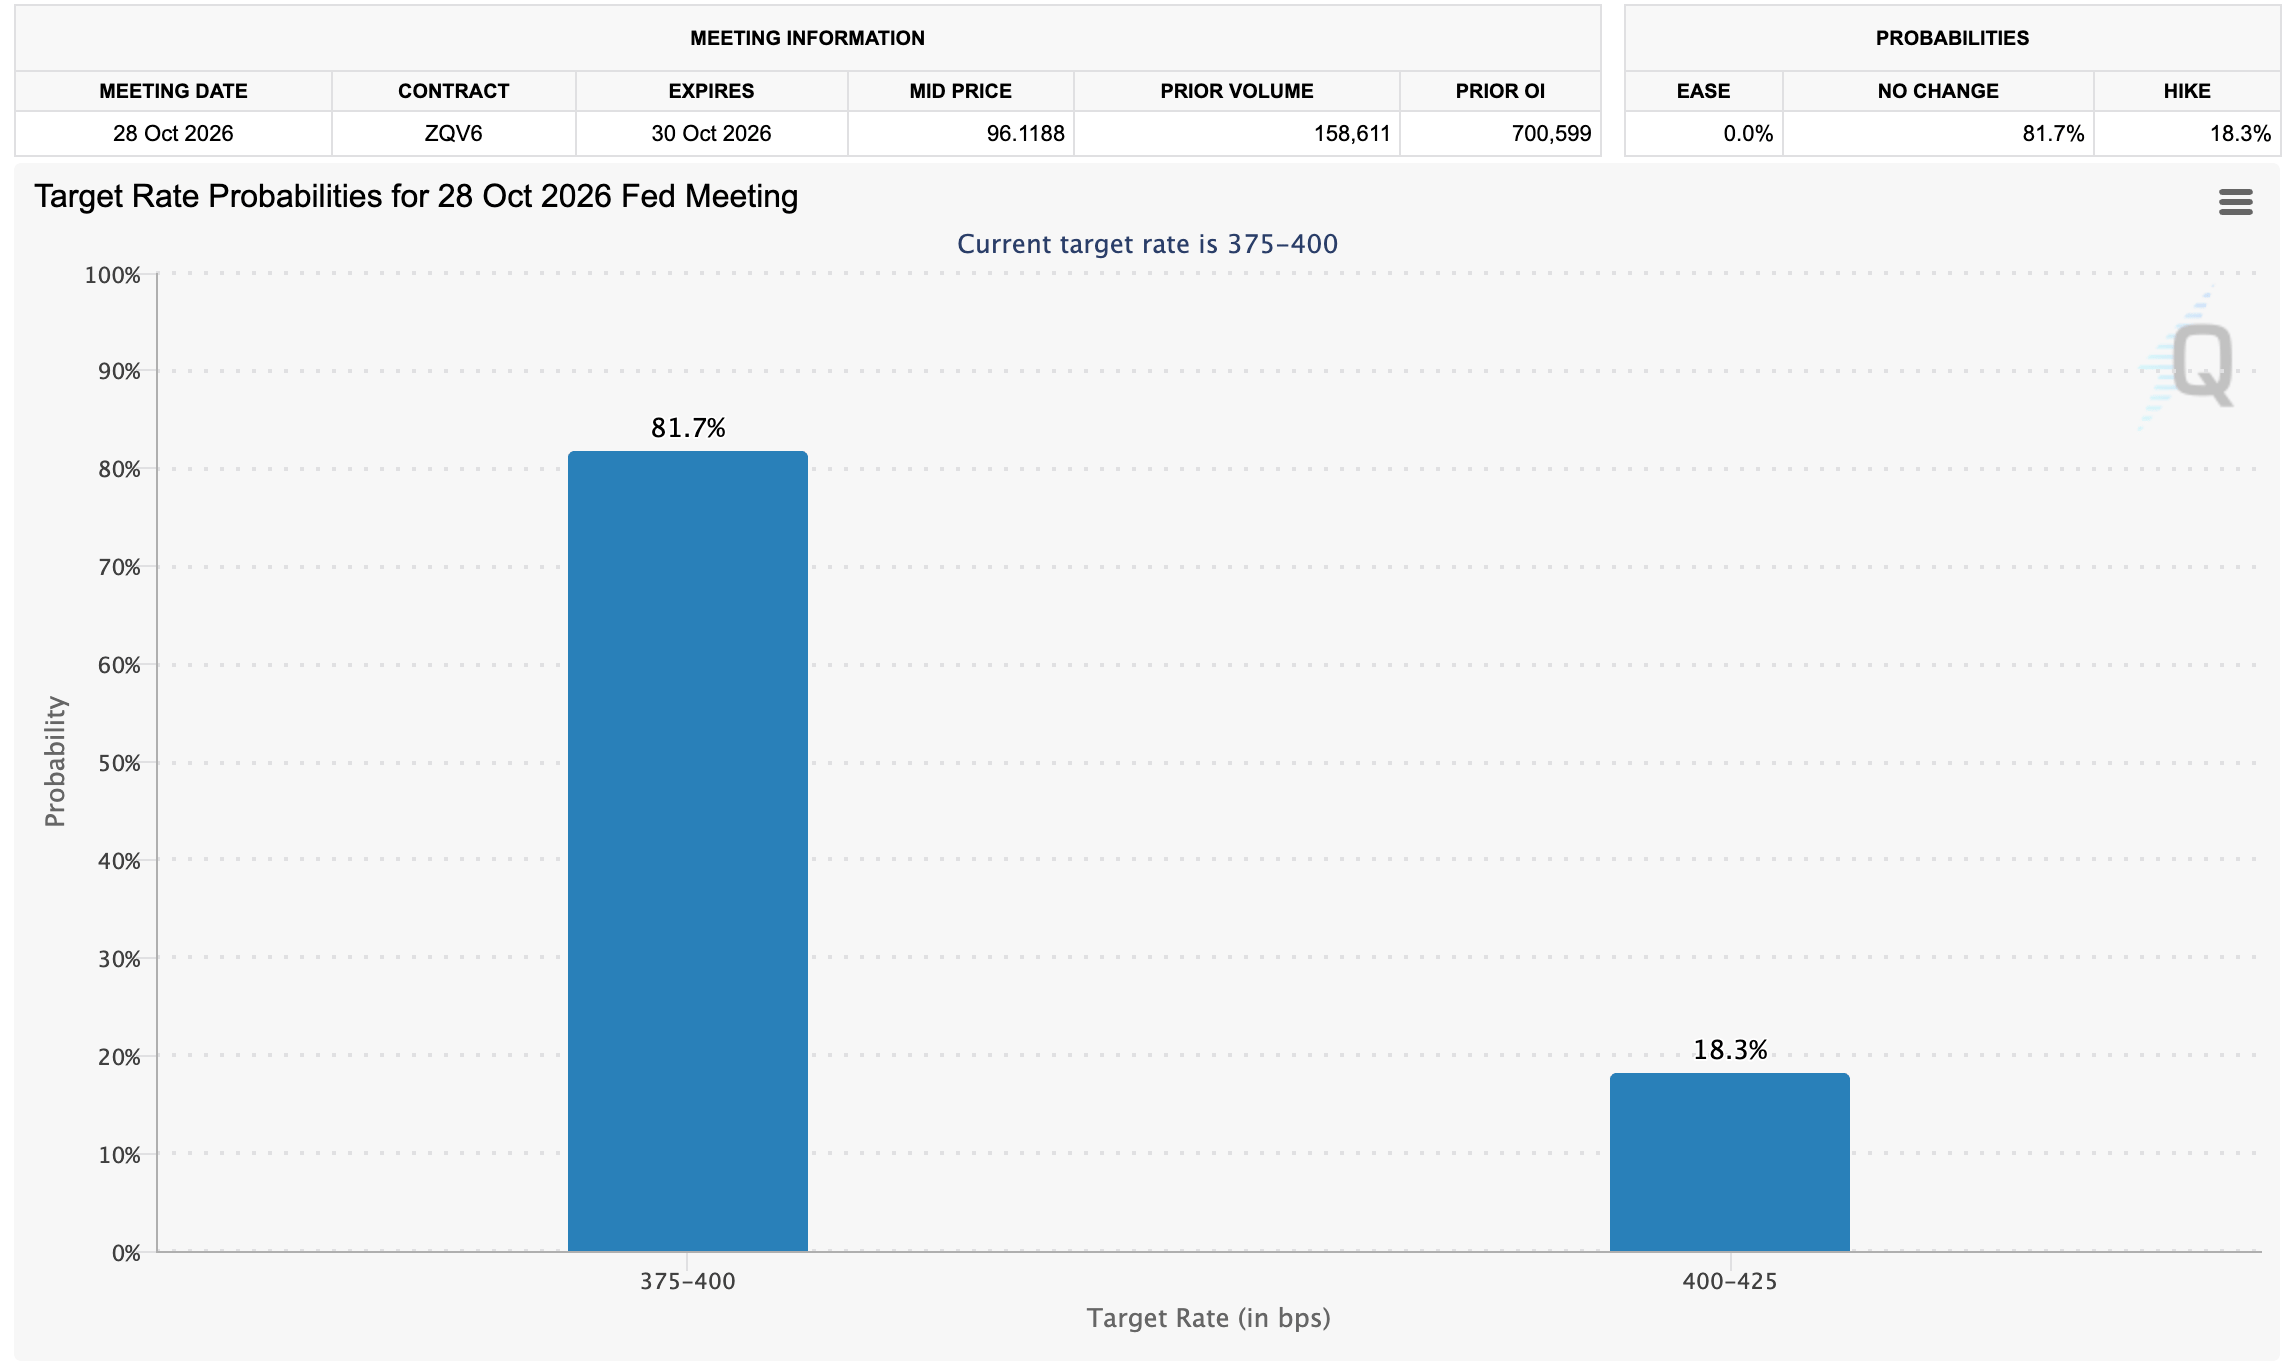
“The Fed is also becoming less of a headwind as markets have gone from pricing roughly a 70% chance of an October hike to around 25% in a matter of days. It gives risk assets more room to move higher,” Markus Levin, Co-founder of XYO, said via email, adding, “I would pay more attention to where Treasury yields go from here than to the day-to-day changes in the Fed’s rate expectations.”
Technical analysis: Bitcoin bulls reclaim trend control
Bitcoin trades at $86,620, extending its advance well above the main Exponential Moving Averages and the active SuperTrend line, which maintains a bullish near‑term bias. The pair holds comfortably above the 50-day EMA near $78,419, the 100-day EMA around $74,772 and the 200-day EMA at $74,970, suggesting a firmly supported underlying uptrend, while the Relative Strength Index (RSI) at 69 keeps price close to overbought territory and hints at a risk of consolidation after the latest surge despite a mildly negative Moving Average Convergence Divergence (MACD) reading below zero.
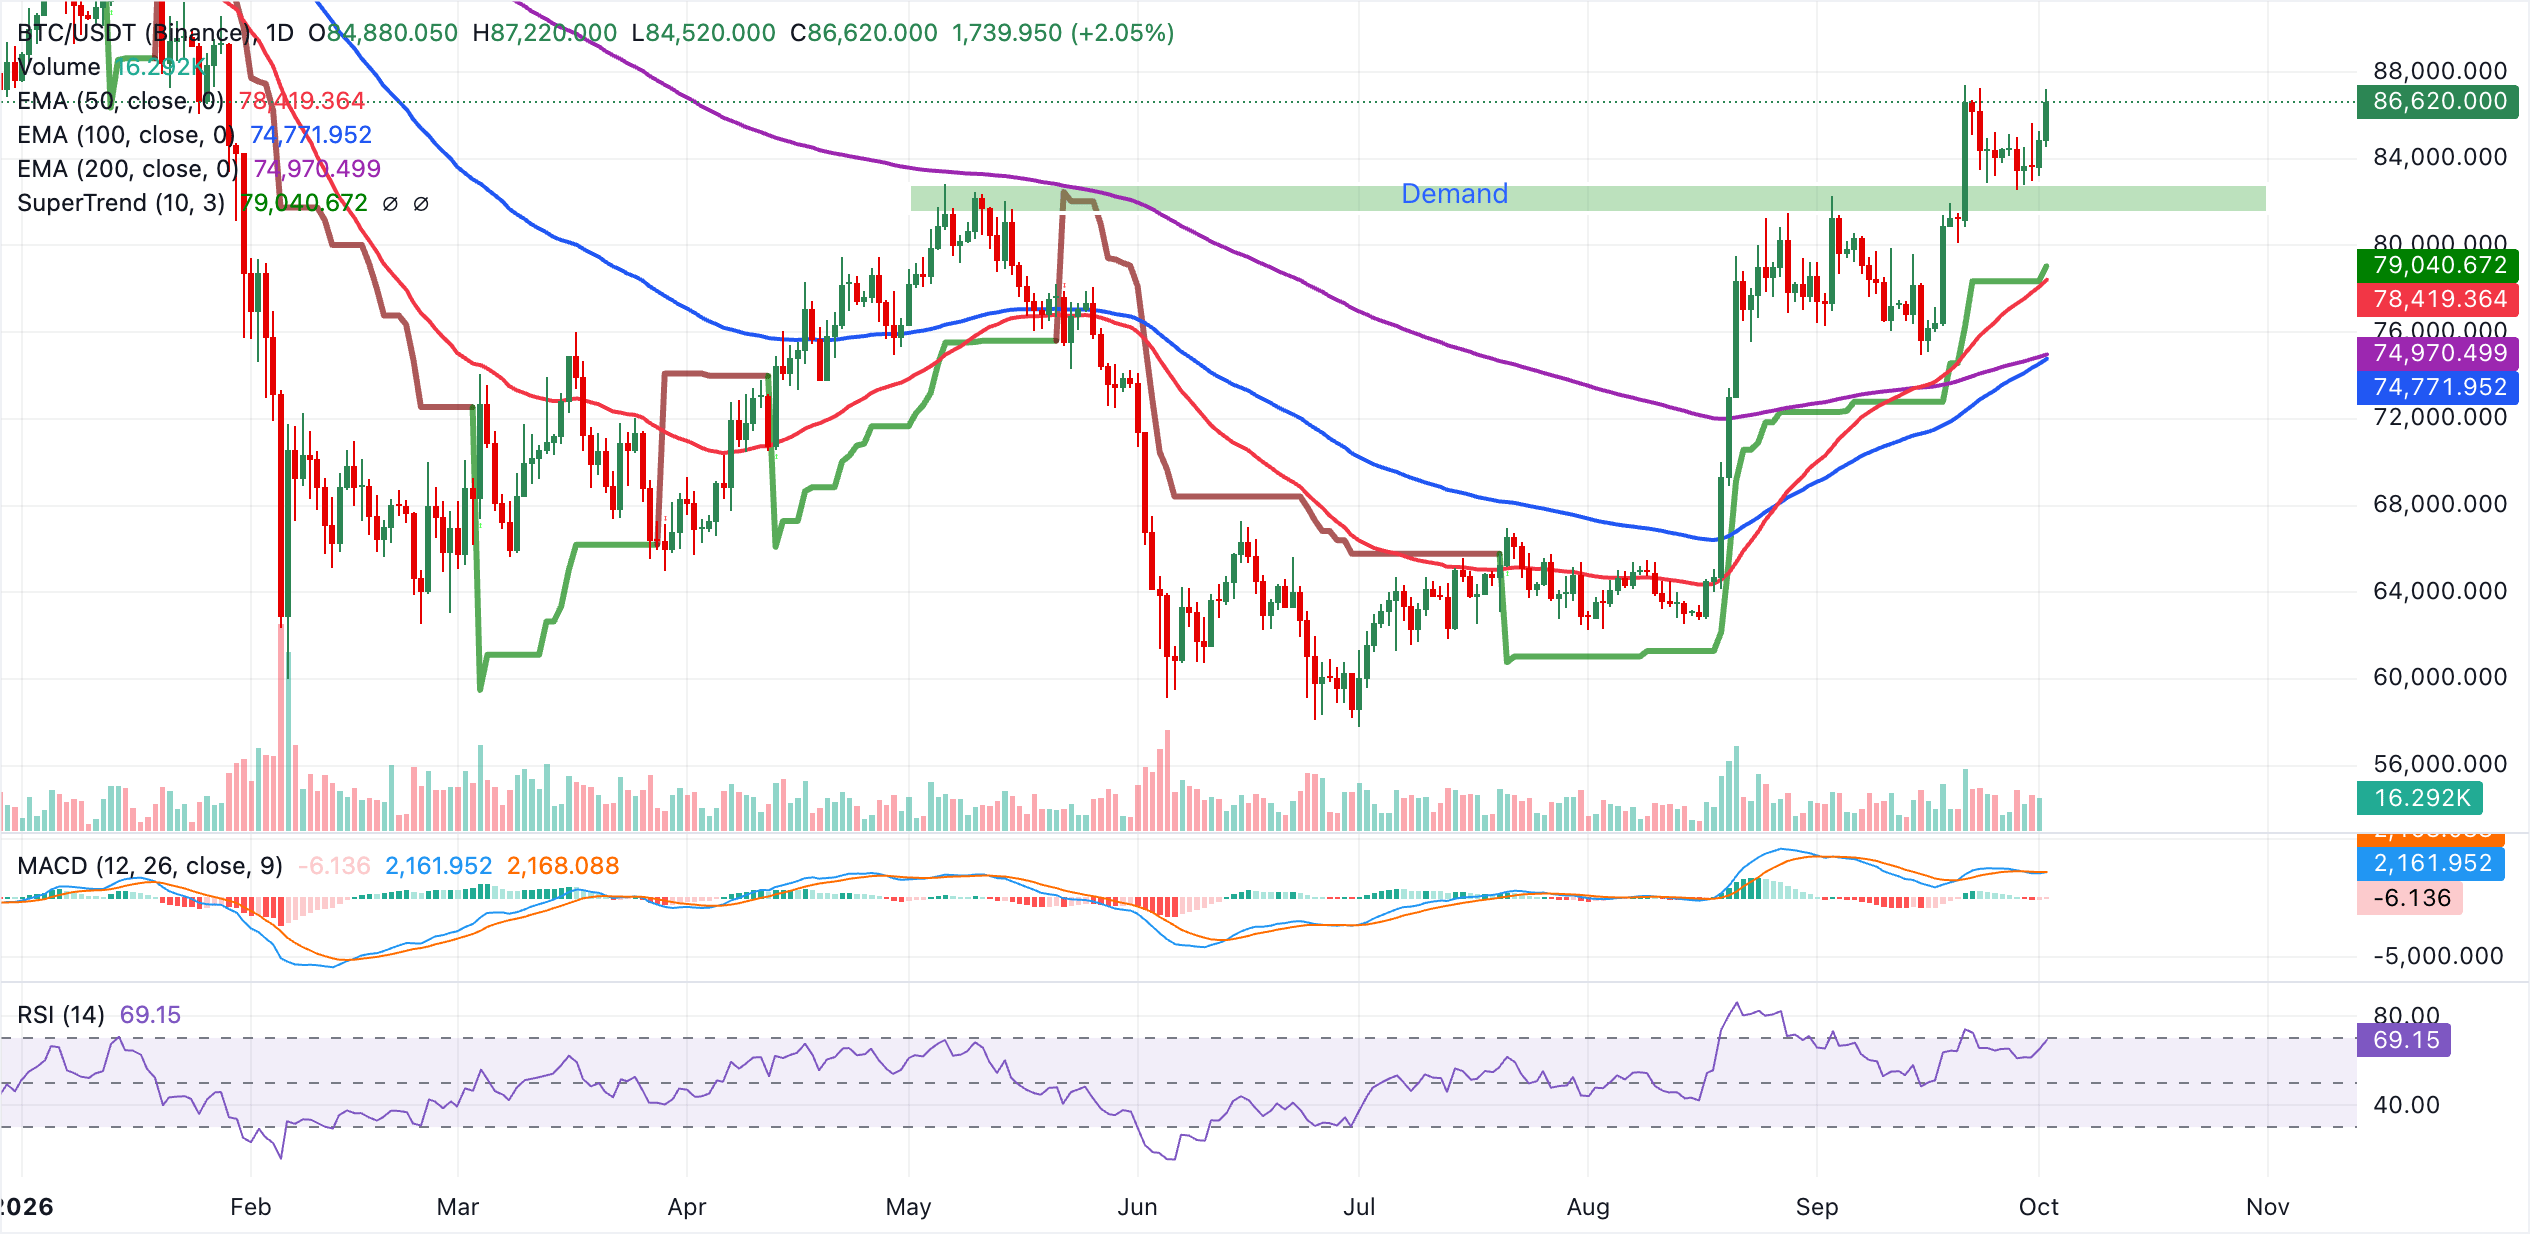
Initial support appears at the SuperTrend trigger around $79,041, reinforced by the 50-day EMA clustered just underneath recent price action, with deeper demand expected toward the 100-day and 200-day EMAs in the $74,800-$74,970 area if a broader correction unfolds.
With no nearby overhead technical barriers on the daily chart, the focus stays on the supply between $88,000 and $90,000 levels and how long buyers can defend the underlying supports. Any sustained break back through the SuperTrend zone would likely shift the tone from a simple pause to a more meaningful pullback within the broader bullish structure.
Gold technical analysis: XAU/USD poised to extend recovery
Gold trades at $4,195, as buyers return anticipating continued gains above the short-term $4,200 hurdle. Despite the metal’s two-day recovery, it remains bearish in the near term as it stays below key moving averages, reinforcing an overhead supply zone.
The SuperTrend line at $4,433 and the descending resistance trendline break level near $4,464 further underline a market that is trading under a dense topside barrier. Momentum aligns with this tone, with the MACD indicator in negative territory and the RSI hovering around 42, suggesting subdued bullish conviction.
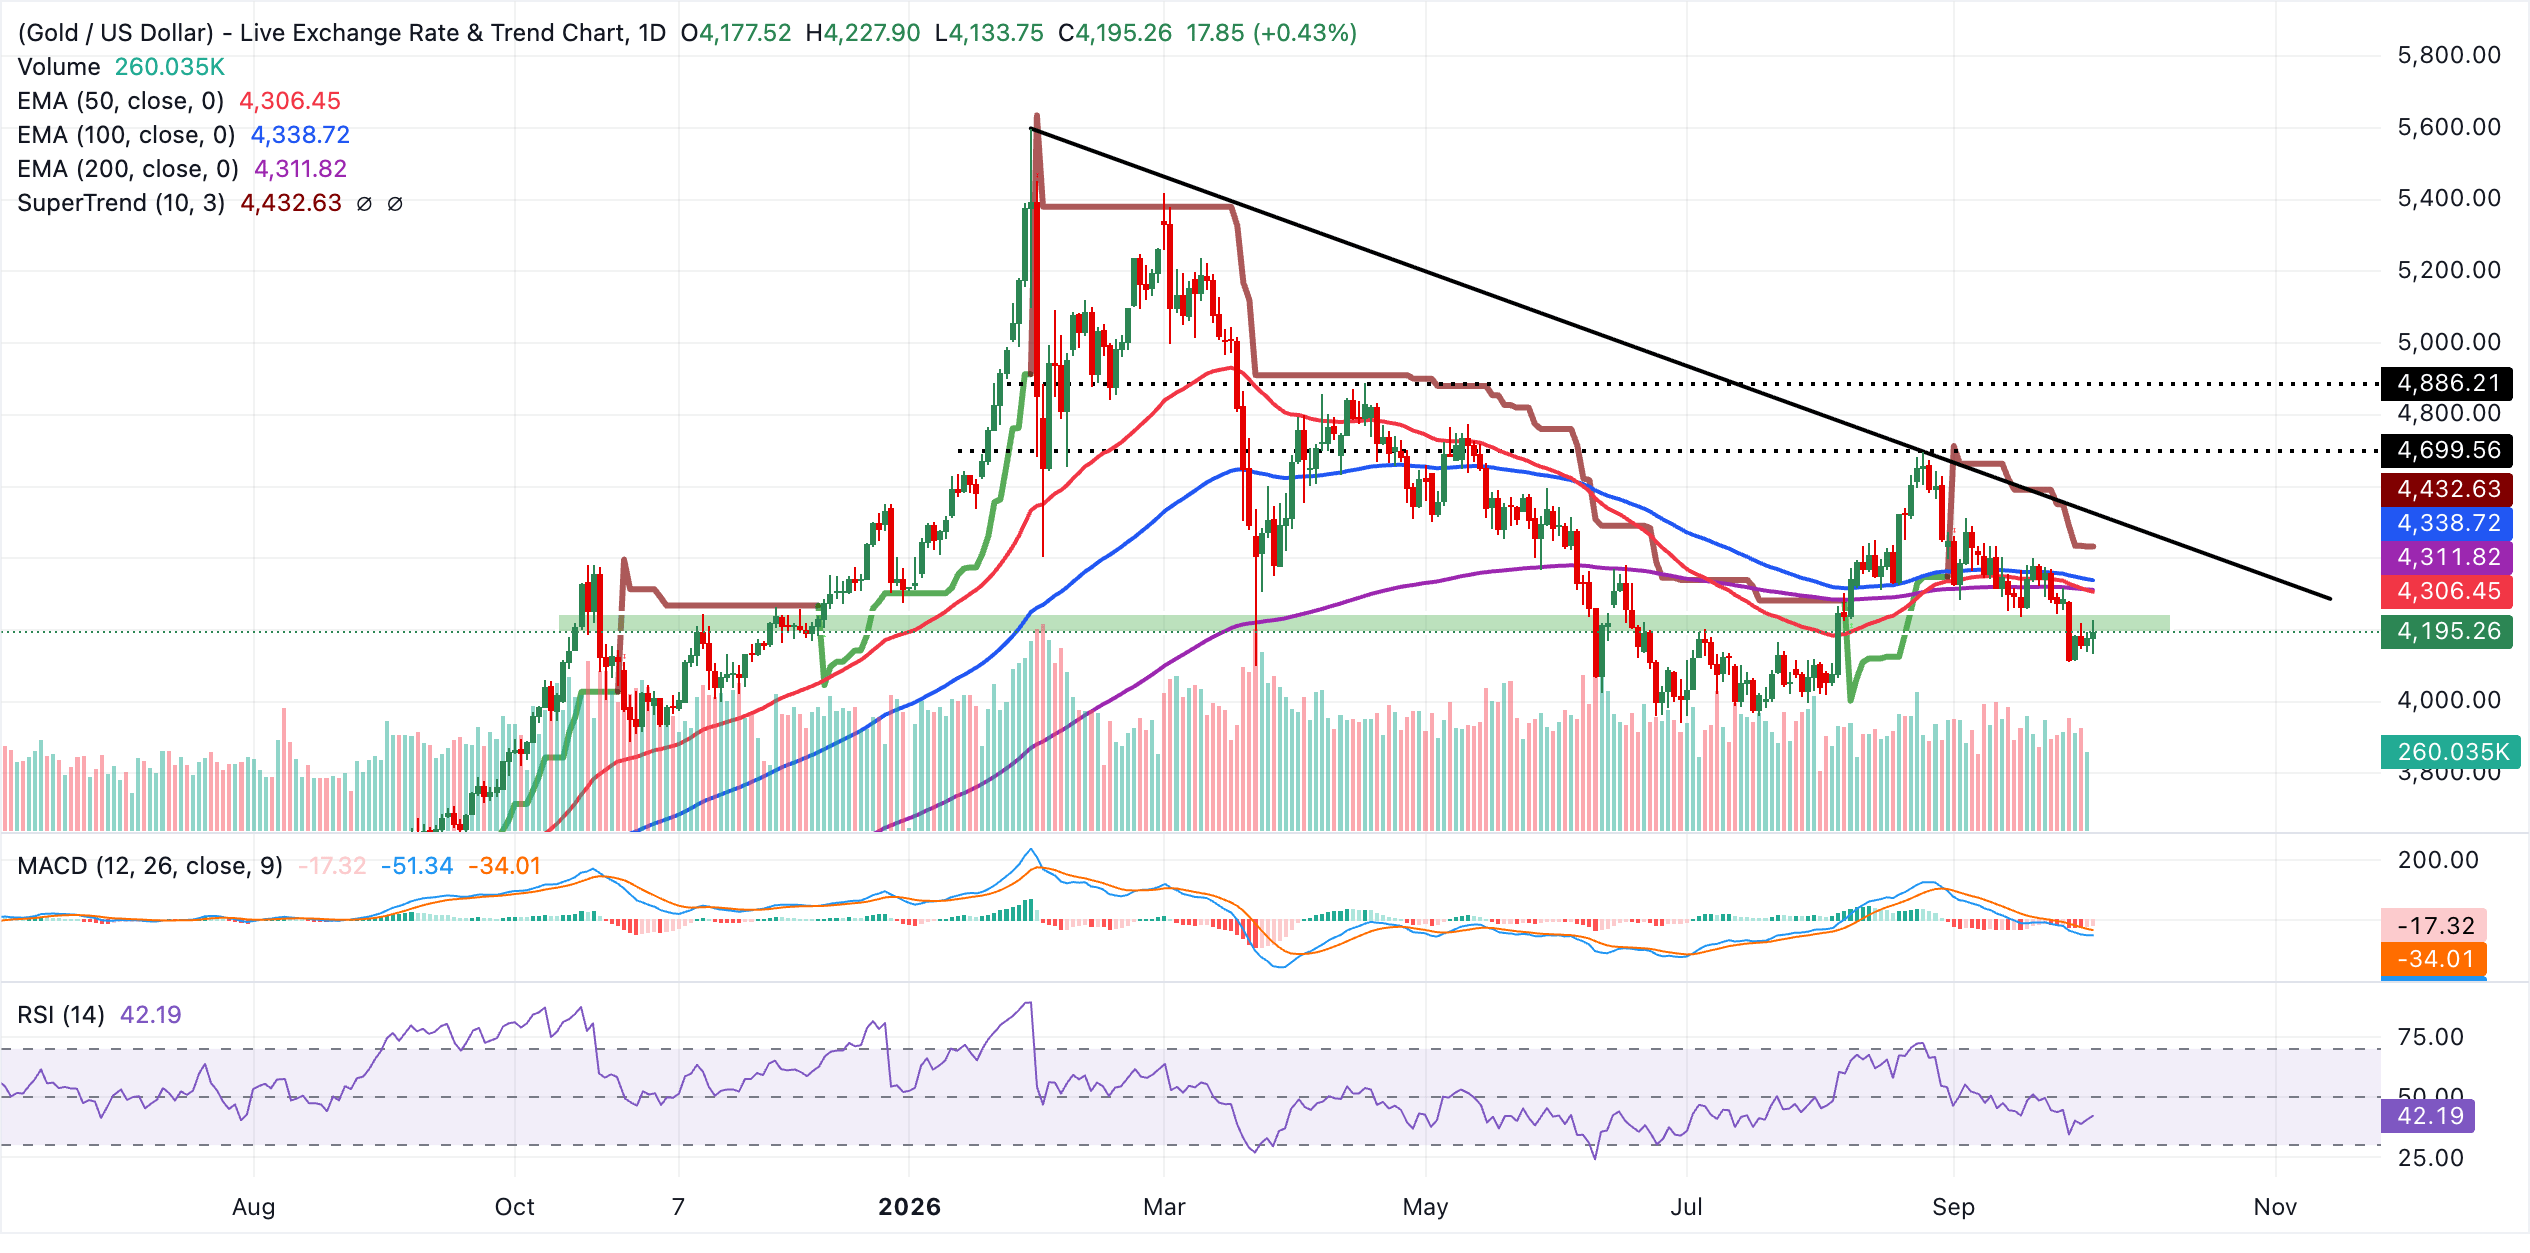
Immediate resistance lies at the 50-day EMA at $4,306, followed closely by the 200-day EMA at $4,312, which together form the first technical hurdle for any rebound. Above this key supply cluster, the 100-day EMA at $4,339 precedes a stronger cluster around the SuperTrend level at $4,433 and the downward-sloping trendline break price near $4,464, where sellers are likely to reassert control if tested.
Gold lacks structural support levels on the daily chart; therefore, focus remains on the next psychological levels at $4,100 and $4,100. An extended correction would reinforce the pair’s technical weakness, and only a sustained move above the EMA cluster would start to ease the prevailing bearish pressure.