S&P 500 — US Large Cap Index
 FTSE 100 — UK Blue Chips
 Euro Stoxx 50 — Eurozone Leaders
 DAX 40 — German Equities
 CAC 40 — French Market Index
 Nikkei 225 — Japan Benchmark
 Hang Seng — Hong Kong Index
 Shanghai Composite — China Mainland
 ASX 200 — Australian Market
 TSX Composite — Canada Index
 Nifty 50 — India Large Cap
 STI Index — Singapore Market
 KOSPI — South Korea Index
 Bovespa — Brazil Equities
 JSE Top 40 — South Africa Index
 IPC Index — Mexico Market
- XRP edges lower on Tuesday, extending its losses for the third straight day.
- XLM is down 3% on Tuesday, extending the 6% loss from the previous day.
- The technical outlook for XRP and XLM is bearish, flashing near-term downside risk.
Ripple (XRP) and Stellar (XLM) are extending losses on Tuesday as both lose momentum. Broader market bearish sentiment and uncertainty, with Bitcoin (BTC) back to $70,000, add to downside pressure, while the biased wipeout of long positions in the derivatives market confirms a sell-side dominance.
Market sentiment weighs down on altcoins
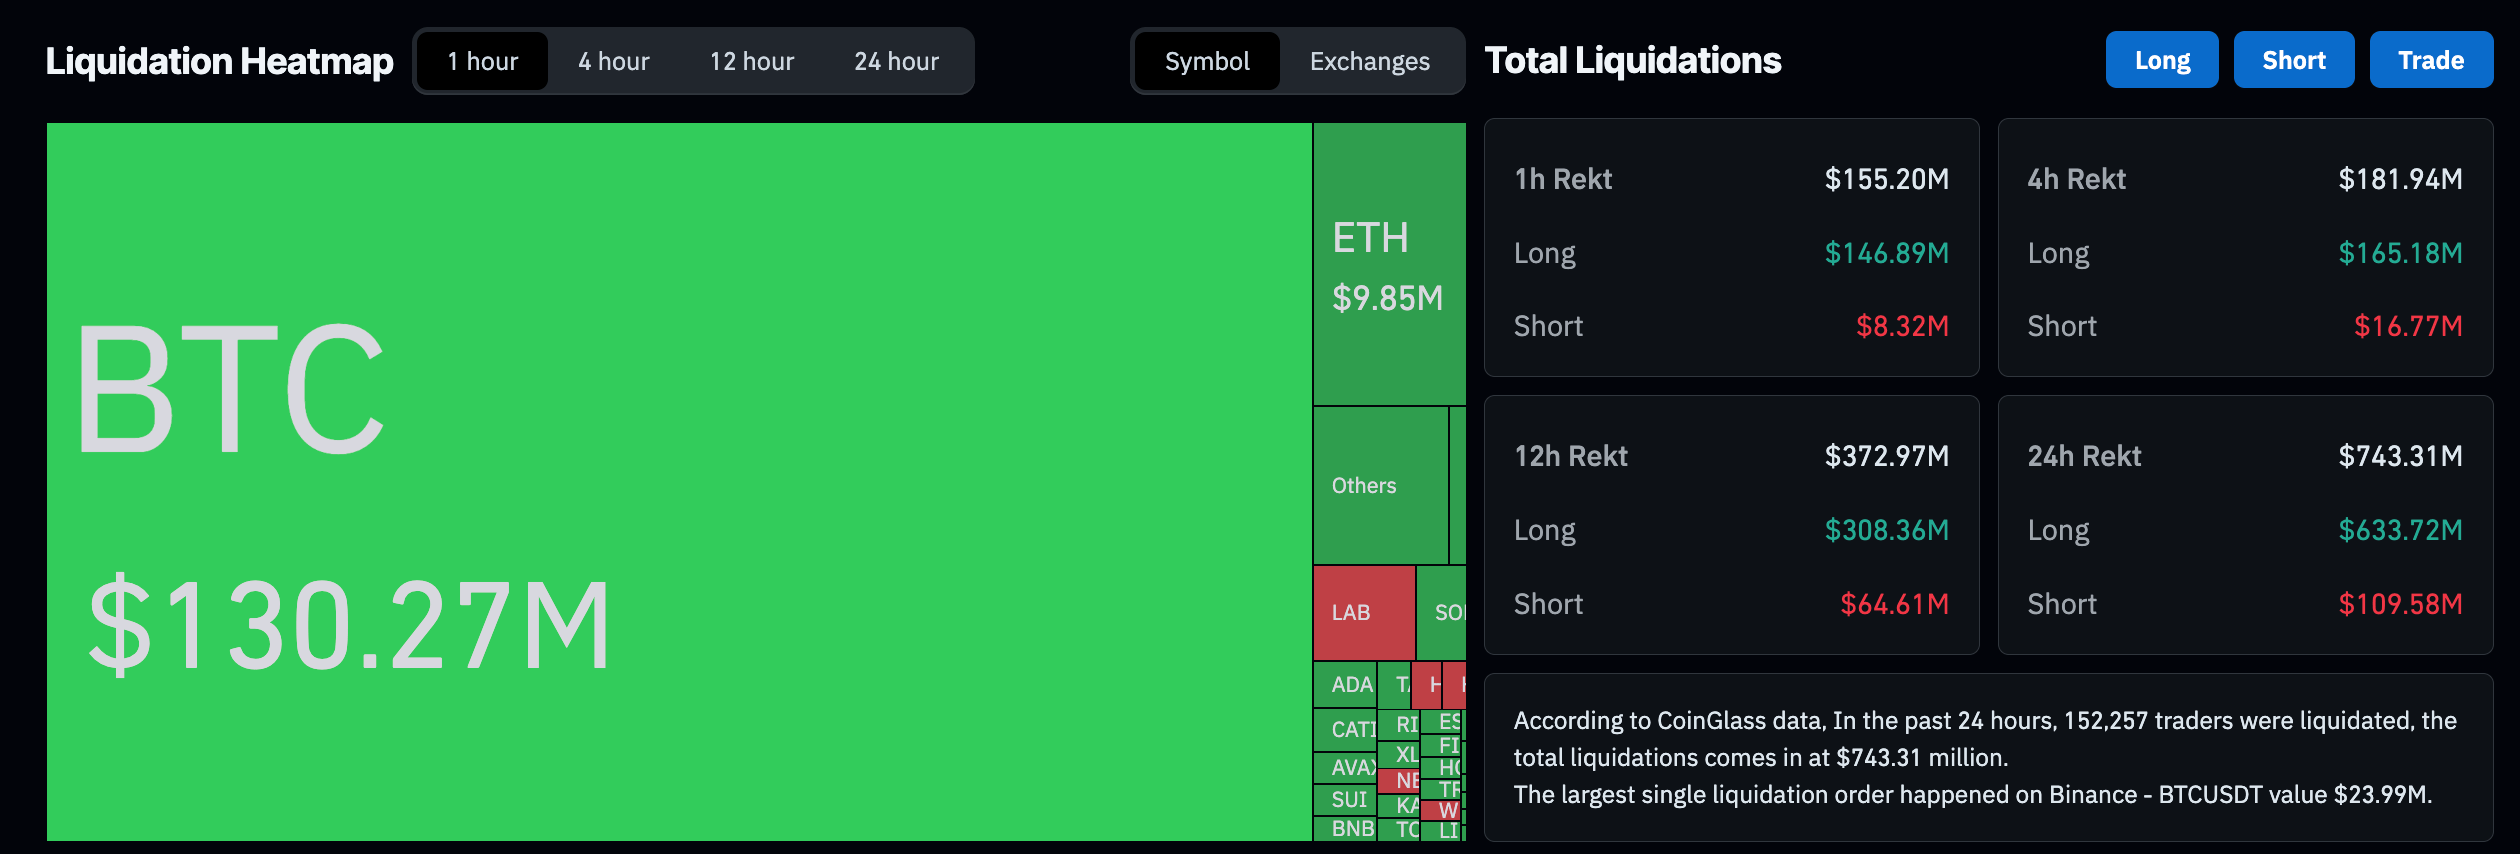
Bitcoin’s slip to $70,000, driven by outflows from corporate holdings like Strategy and other Exchange-Traded Funds (ETFs), is dragging down altcoins. CoinGlass data shows a $743 million wipeout of leveraged positions over the last 24 hours, led by $633 million in long positions, suggesting bearish dominance.
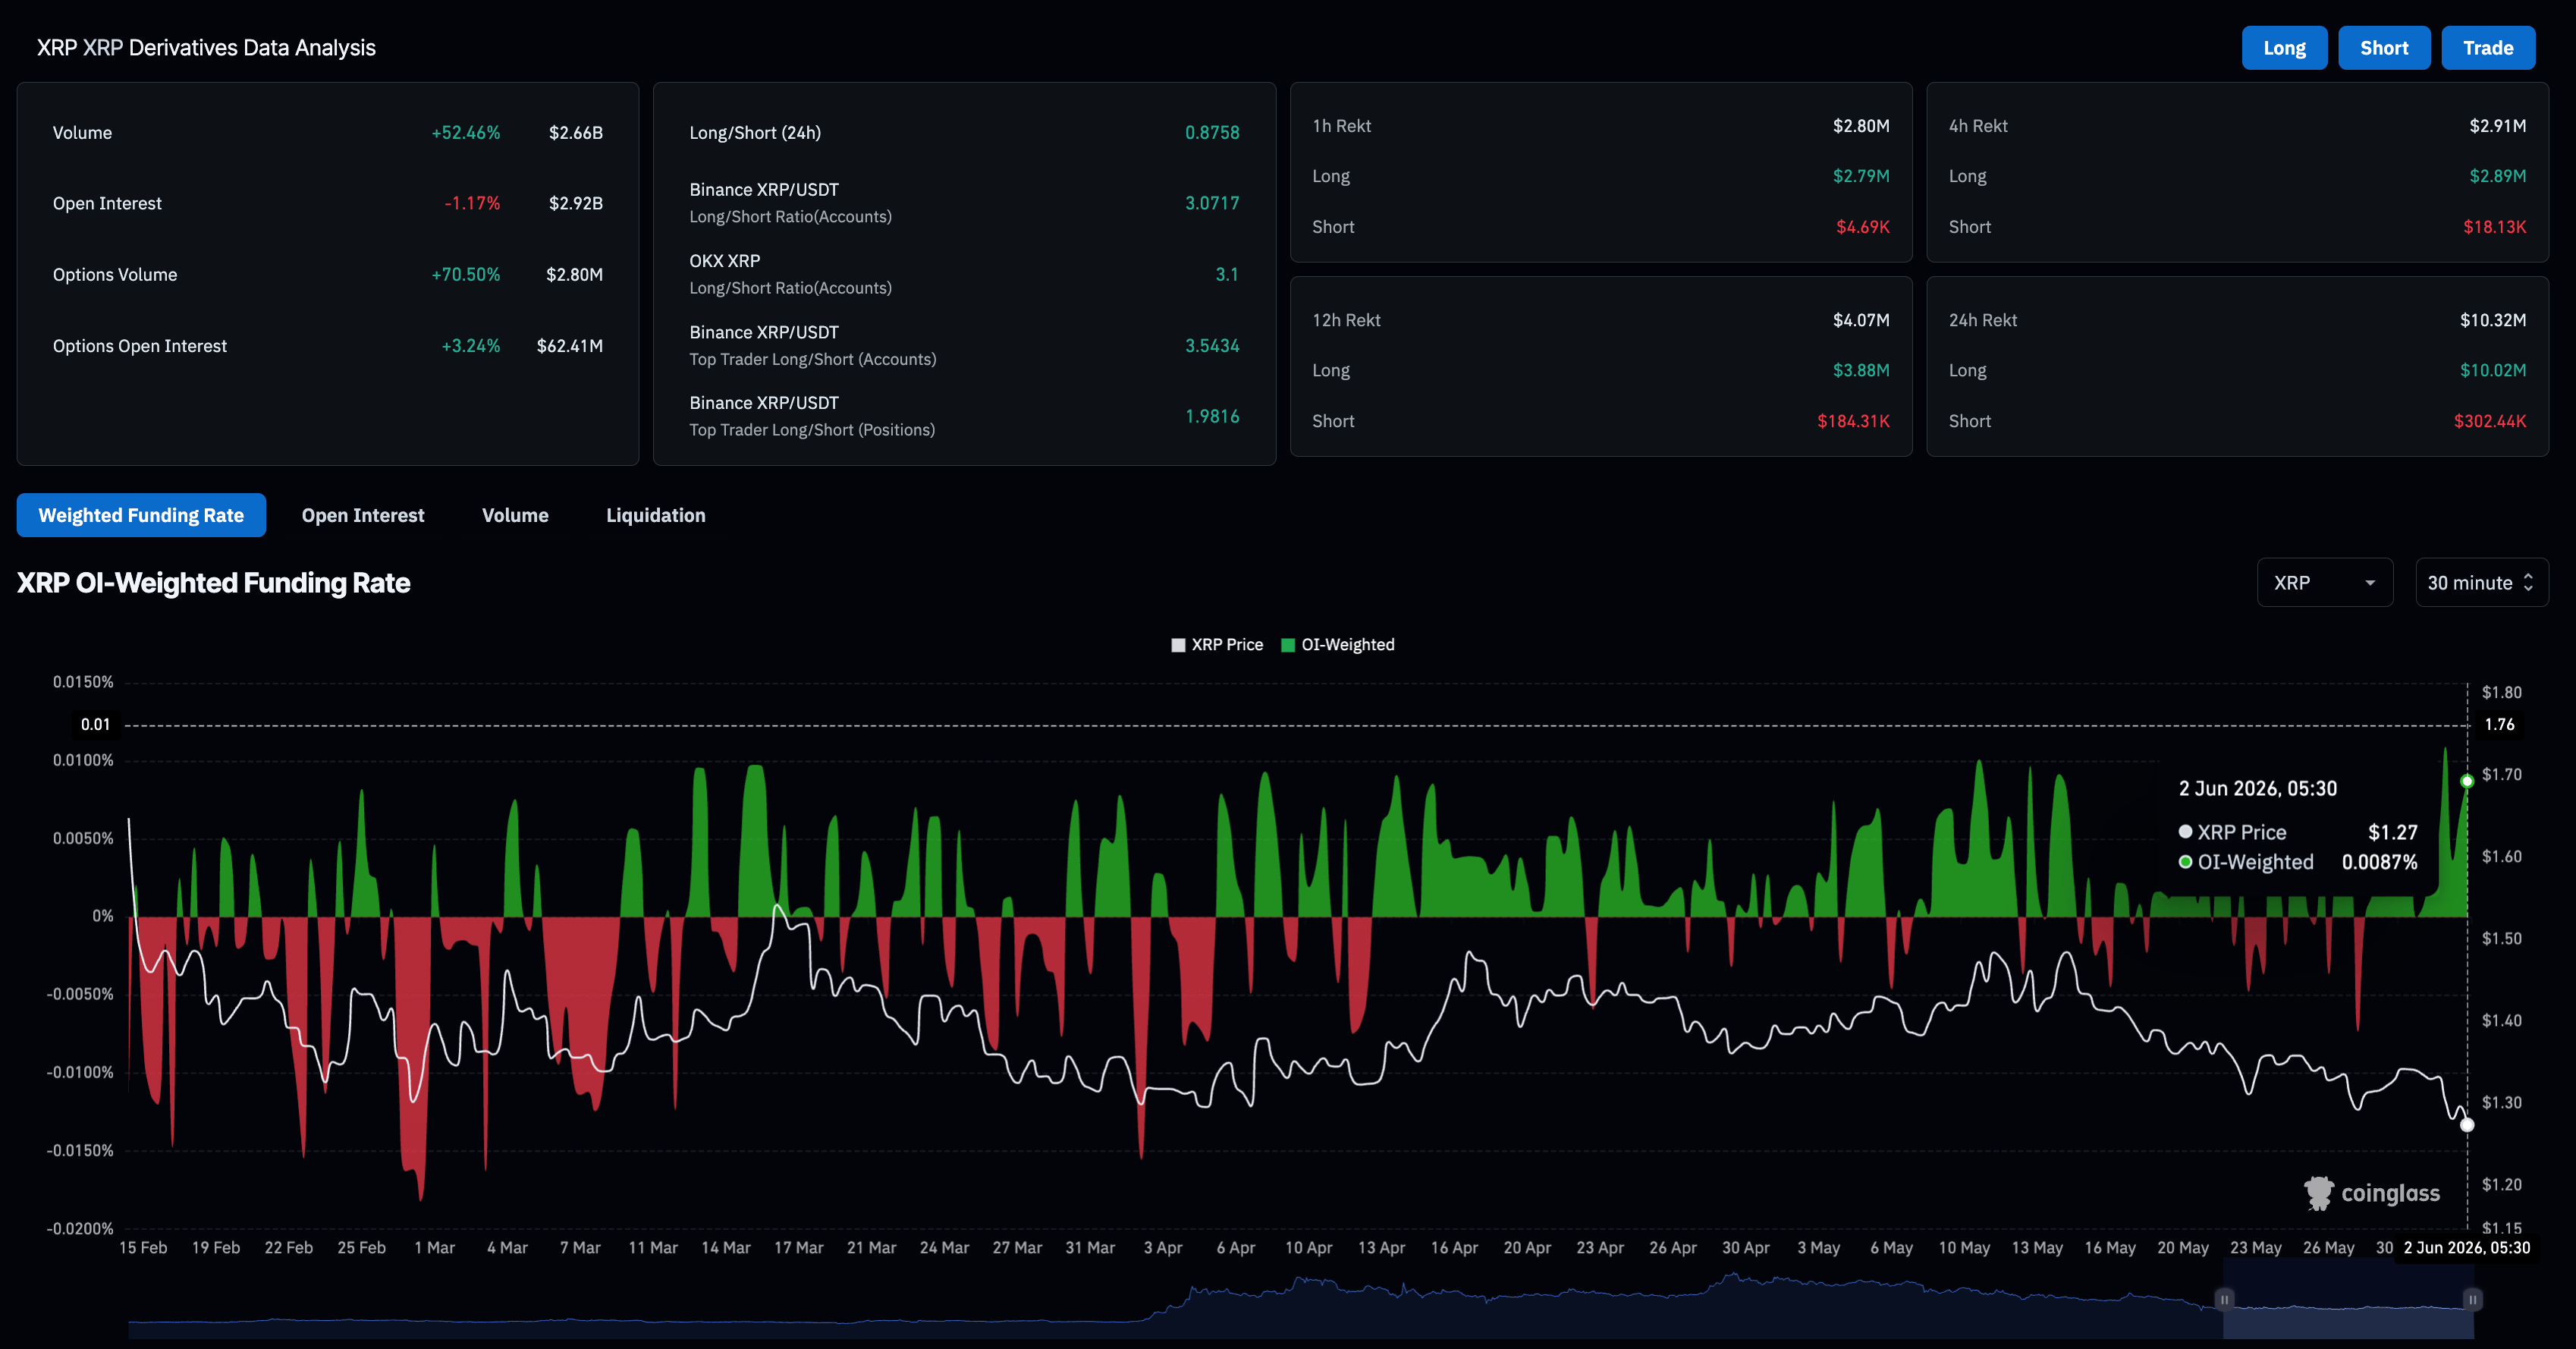
In the case of XRP, total liquidations in the same period reached $10.32 million, out of which $10.02 million were forced liquidations of long positions. XRP futures Open Interest (OI) has dropped 2% in 24 hours to $2.92 billion, reflecting reduced risk exposure as the value of outstanding contracts declines.
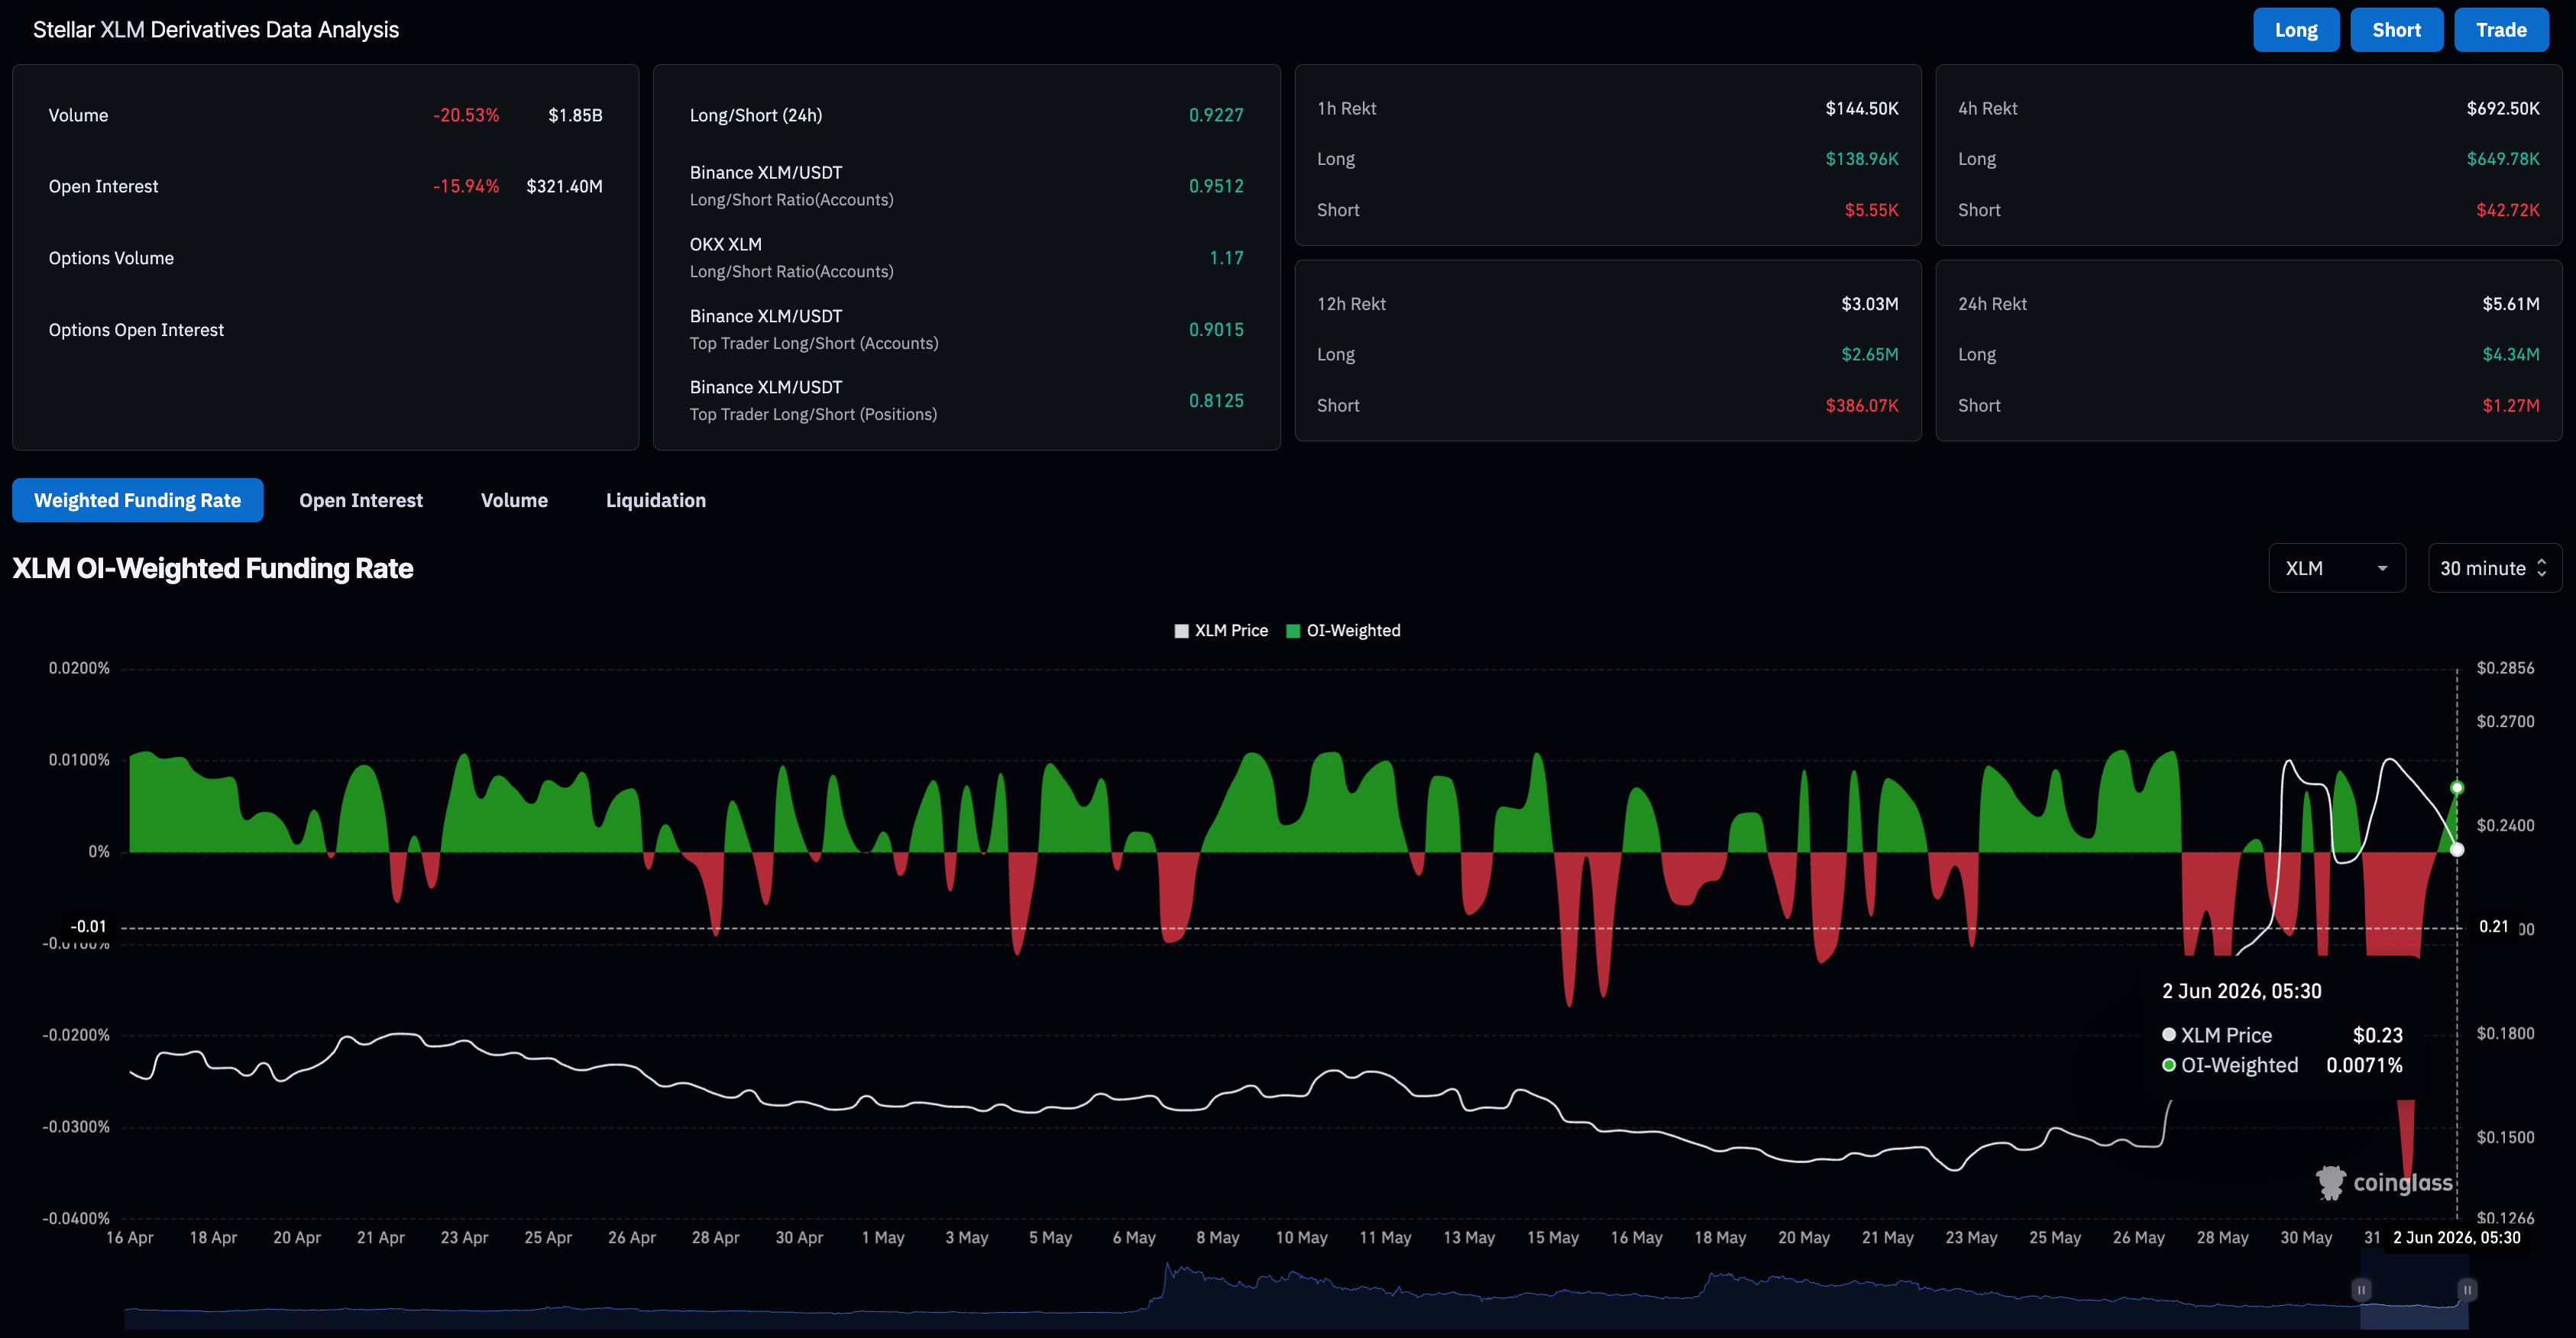
Similarly, XLM derivatives recorded $5.61 million in total liquidations, led by $4.34 million of long liquidations, reaffirming the sell-side dominance. XLM OI is down roughly 16% over the same period to $321.40 million amid risk-off sentiment.
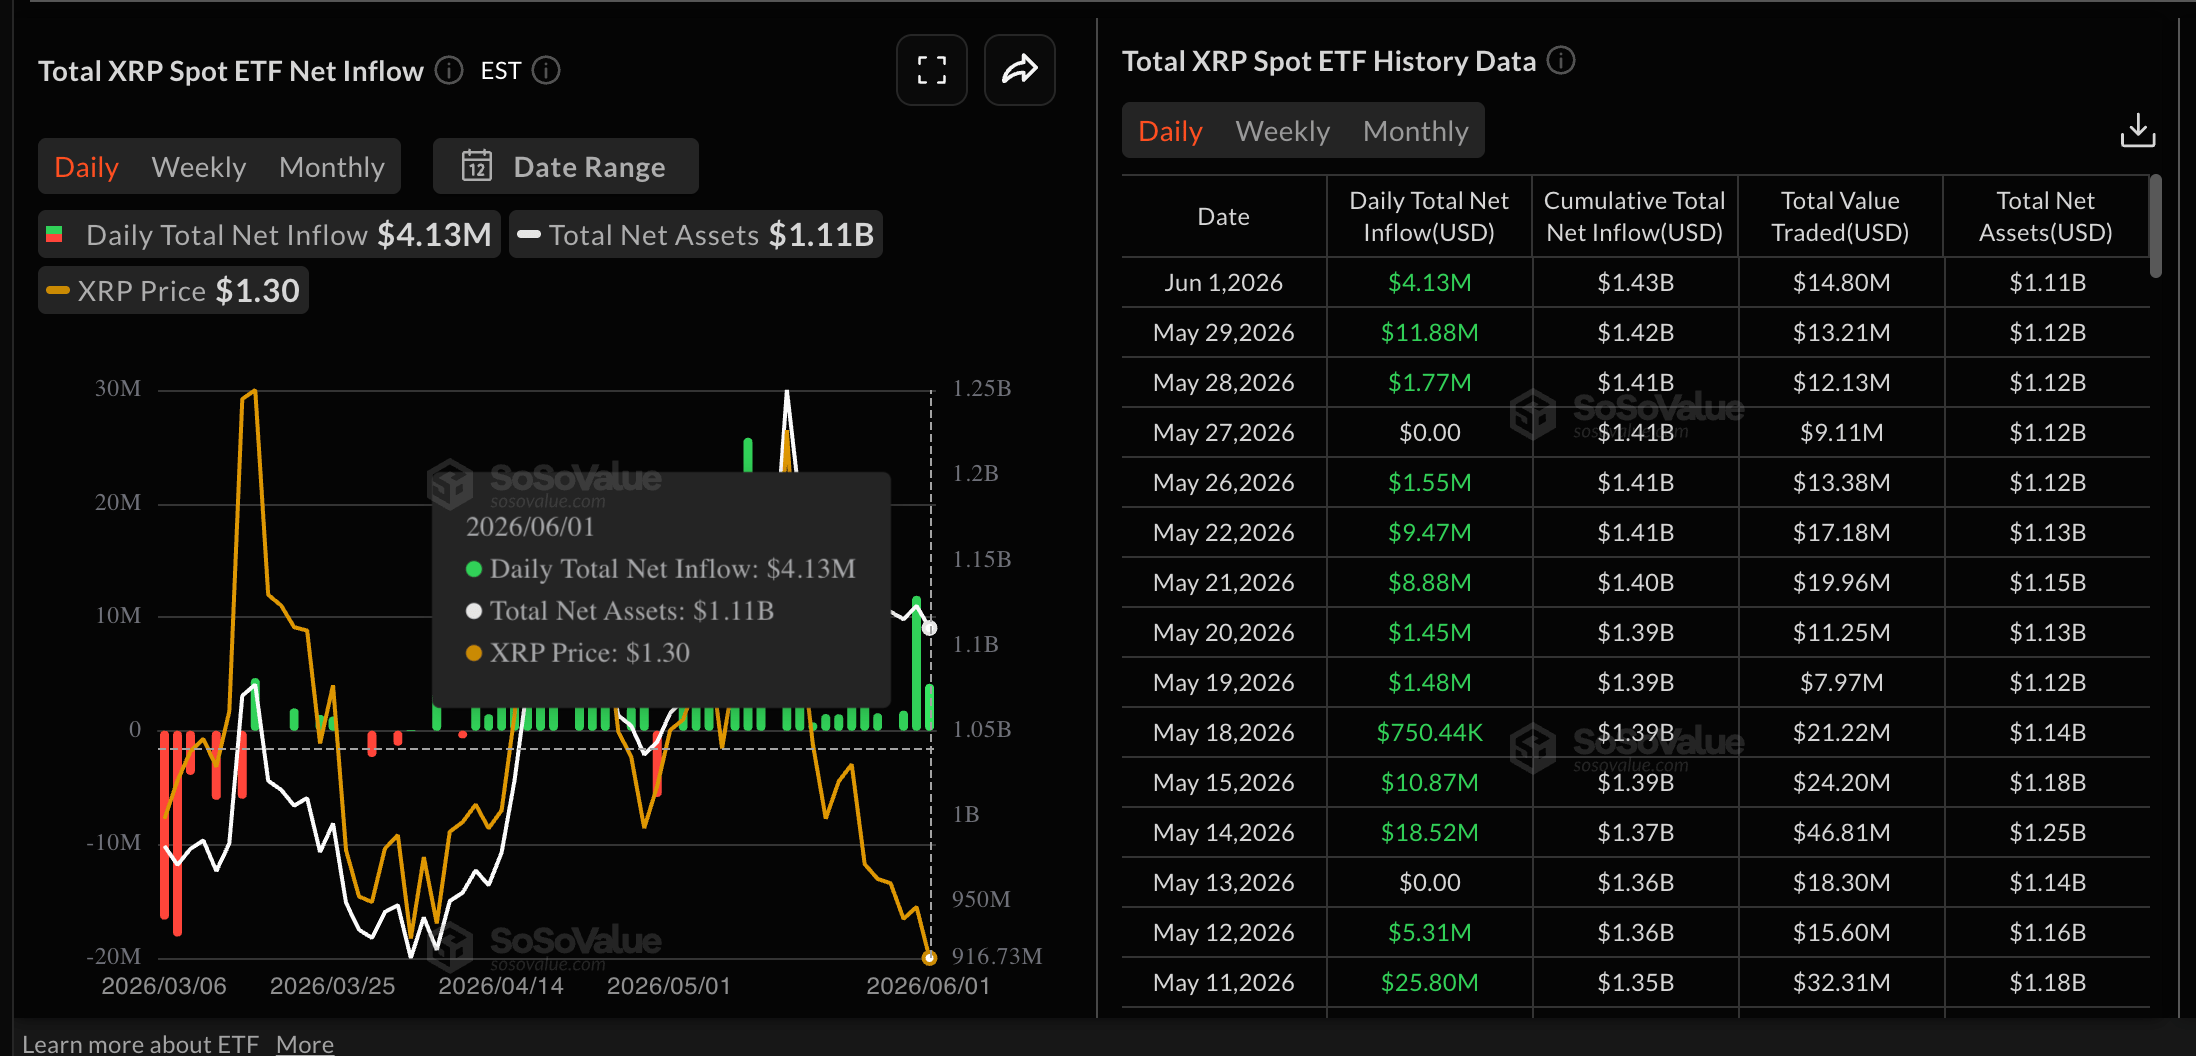
On the institutional side, XRP remains in demand. SoSoValue data shows $4.13 million in inflows over the last 24 hours, extending the $15.20 million inflows from last week.
Technical outlook: XRP and XLM flash for near-term correction
XRP is trading below $1.300 at press time on Tuesday, extending its decline for the third consecutive day. The cross-border remittance token is approaching the demand zone between $1.2700 and $1.2543, marked by the lows on February 28 and October 10.
XRP maintains a bearish near-term bias as price remains below the 50-, 100-, and 200-day Exponential Moving Averages (EMAs) at $1.3782, $1.4519, and $1.6707, respectively. The Moving Average Convergence Divergence (MACD) remains in the negative territory below its signal line, while the Relative Strength Index (RSI) at 34 hovers just above oversold conditions, hinting that selling pressure persists.
A decisive close below the $1.2700-$1.2543 zone could extend XRP’s decline to the February 6 low at $1.1179.

On the topside, initial resistance is located at the 50-day EMA around $1.3782, with the 100-day EMA at $1.4520 reinforcing a broader supply zone ahead.
In the case of XLM, the price struggles to hold above the $0.2500 at press time on Tuesday, reflecting firm overhead pressure. Still, XLM holds a broadly bullish bias with price significantly above the 200-day EMA at $0.1995, which now underpins the advance.
Momentum remains strong but stretched, with the RSI hovering in bullish territory near 65 and the MACD histogram staying positive, suggesting that upside pressure remains dominant even as the recent rally cools.
To reinstate an upward trend, XLM should secure a decisive close above $0.2600, targeting the $0.3000 round figure.
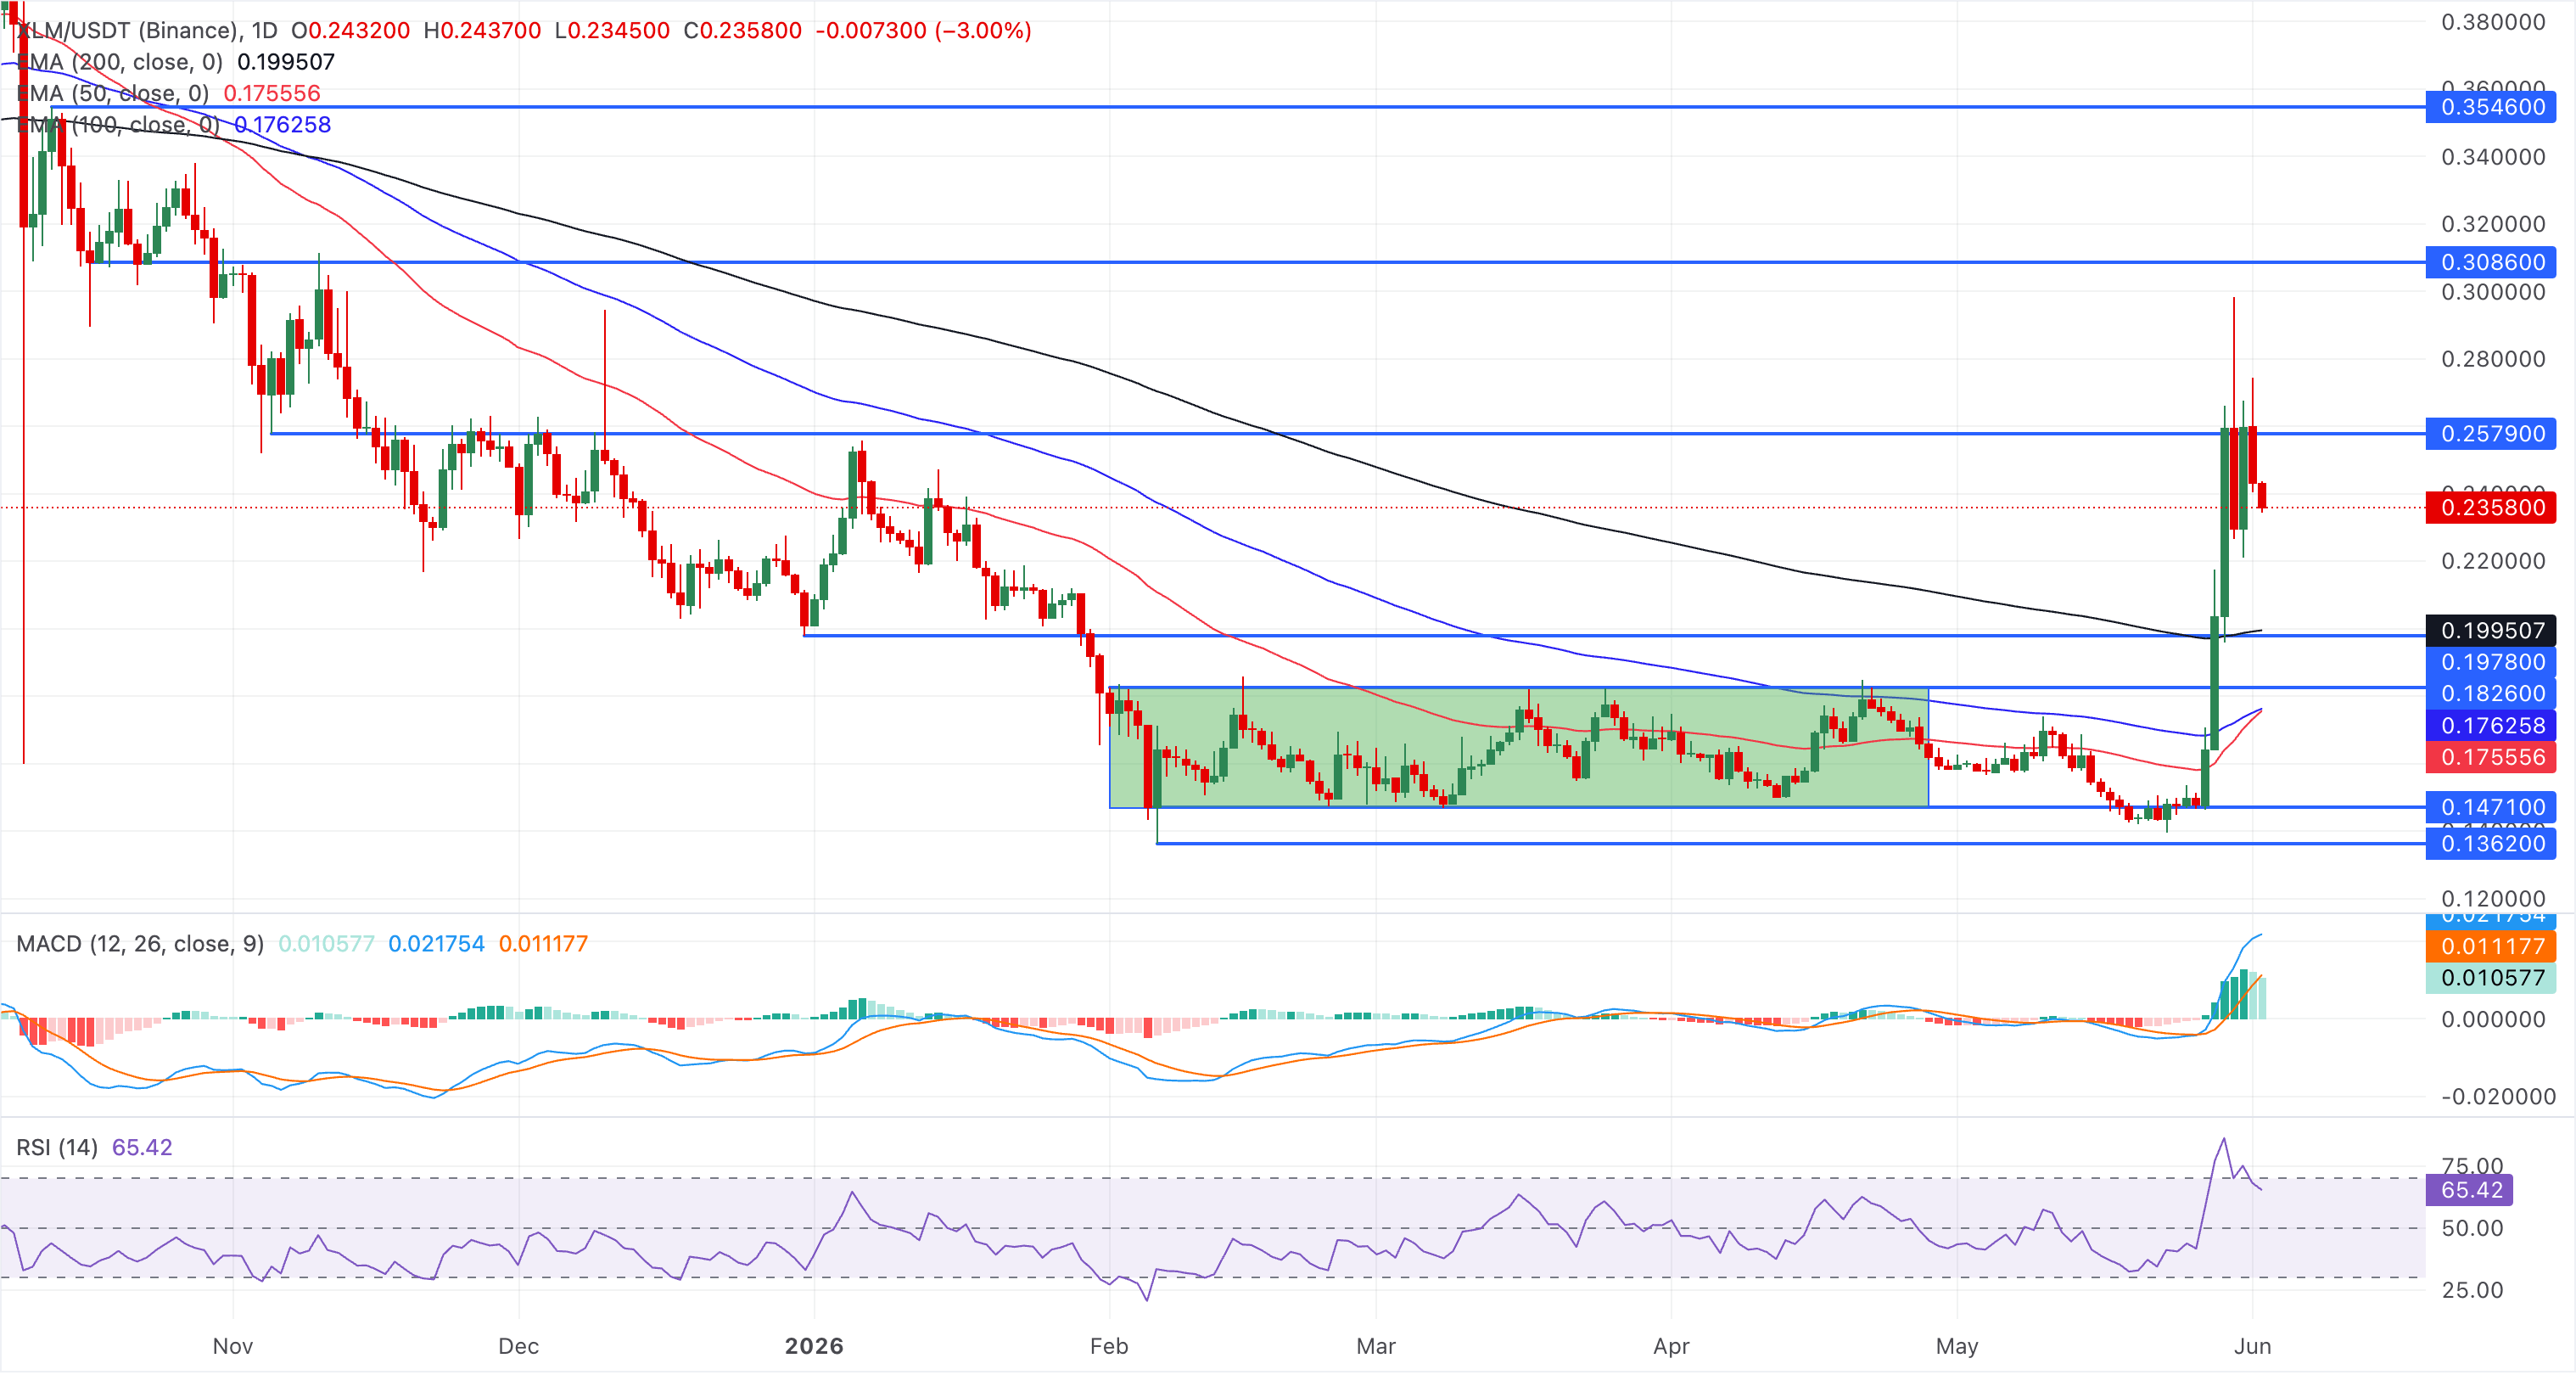
On the downside, initial support is located at the 200-day EMA at $0.1995, where buyers are likely to defend the breakout zone on pullbacks. As long as price holds above this area, the broader bullish structure remains intact.