S&P 500 — US Large Cap Index
 FTSE 100 — UK Blue Chips
 Euro Stoxx 50 — Eurozone Leaders
 DAX 40 — German Equities
 CAC 40 — French Market Index
 Nikkei 225 — Japan Benchmark
 Hang Seng — Hong Kong Index
 Shanghai Composite — China Mainland
 ASX 200 — Australian Market
 TSX Composite — Canada Index
 Nifty 50 — India Large Cap
 STI Index — Singapore Market
 KOSPI — South Korea Index
 Bovespa — Brazil Equities
 JSE Top 40 — South Africa Index
 IPC Index — Mexico Market
Bitcoin, Ethereum, Ripple – BTC eyes $85,000, ETH holds support, XRP stabilizes


- Bitcoin extends its rebound, trading above $83,400 on Wednesday and heading toward $85,000 resistance.
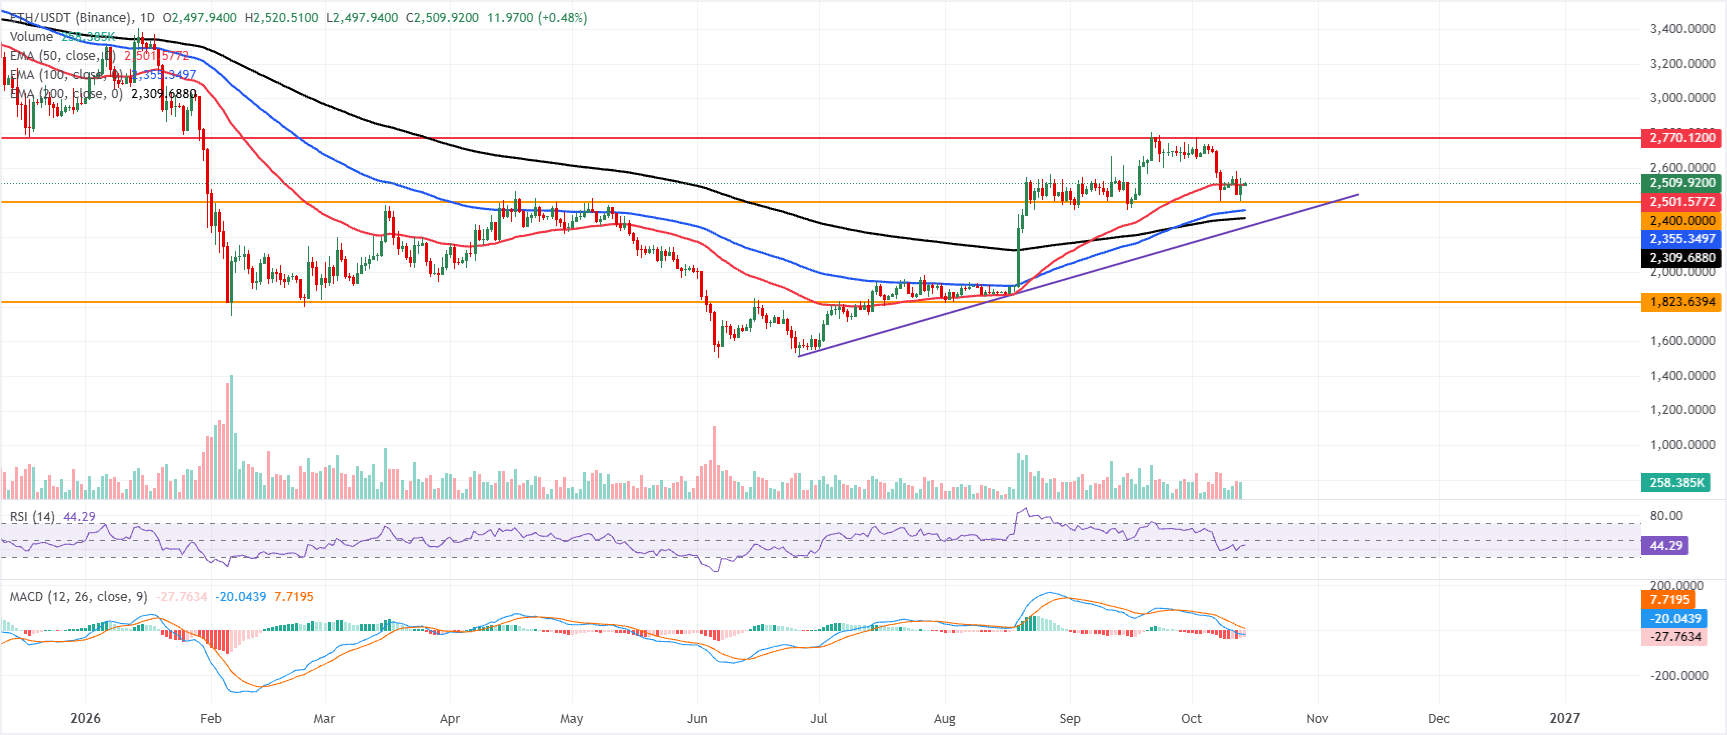
- Ethereum trades above the 50-day EMA around $2,501 after finding support around $2,400.
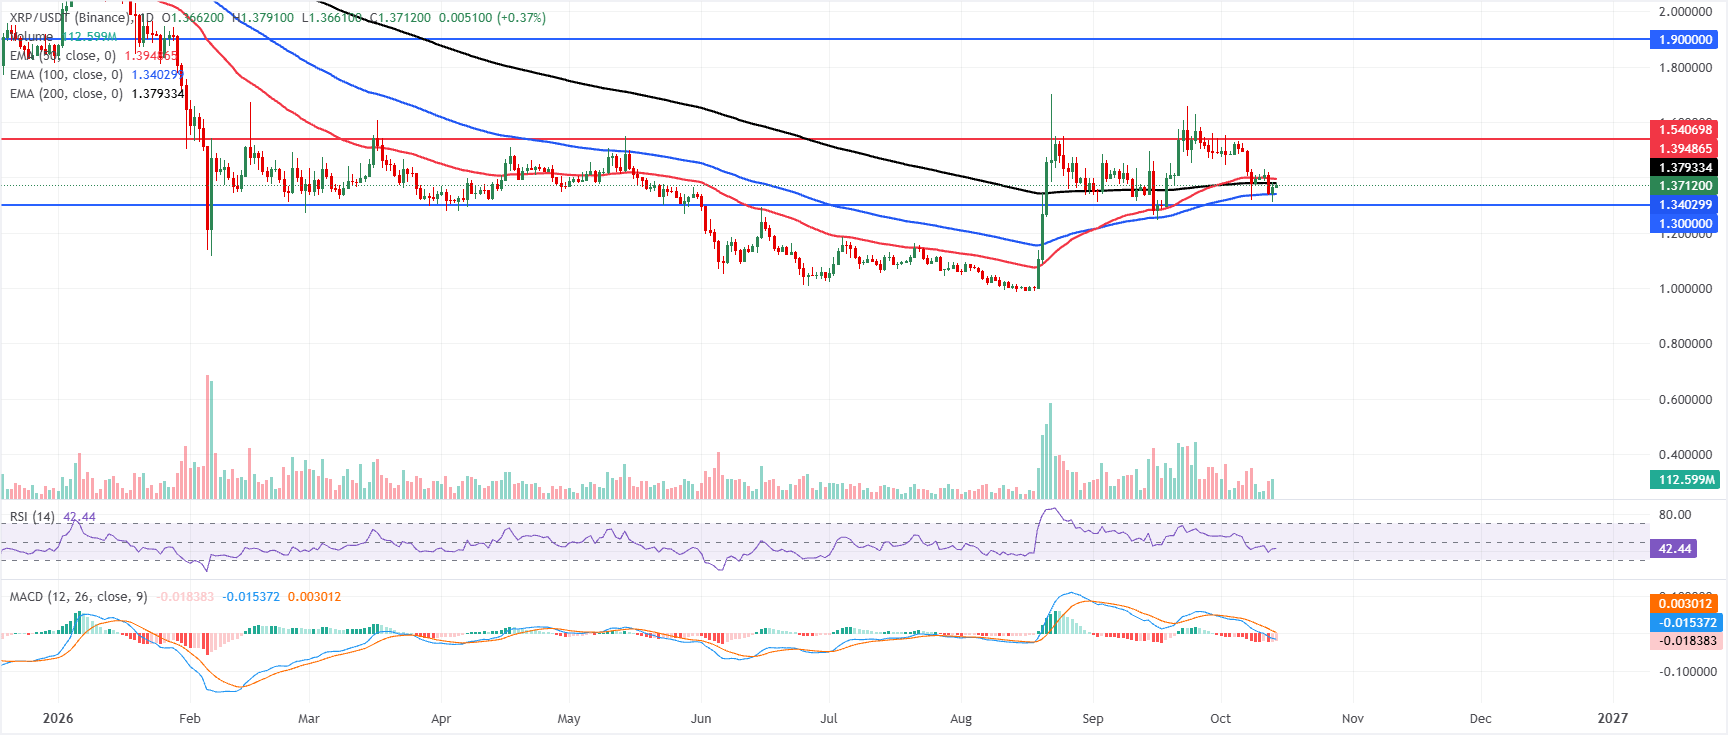
- XRP is around $1.37, hovering around the key EMA cluster.
Bitcoin (BTC), Ethereum (ETH), and Ripple (XRP) show signs of recovery on Wednesday as buyers try to regain control after their recent market weakness. BTC extends its rebound toward the $85,000 resistance, while ETH and XRP find support around key levels.
Bitcoin holds above key EMA supports
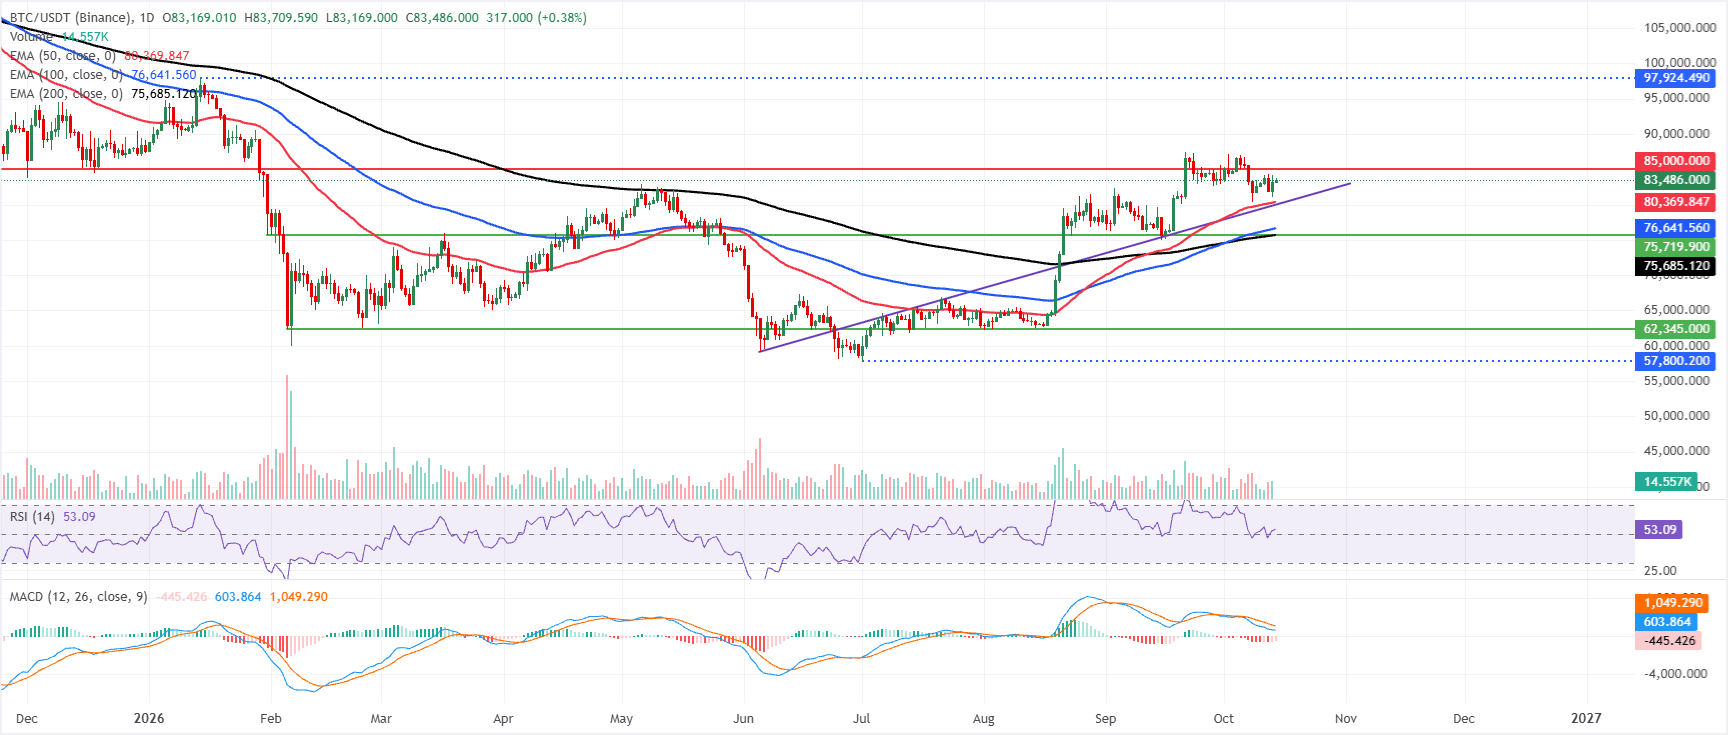
Bitcoin price trades at $83,480 on Wednesday, maintaining a bullish bias as it stays above the 50-day, 100-day, and 200-day Exponential Moving Averages (EMAs) at $80,369, $76,641, and $75,685, respectively.
The clustering of these EMAs below price suggests a well-supported uptrend, even as the latest Relative Strength Index (RSI) reading around 53 keeps momentum in a neutral-to-positive zone. The Moving Average Convergence Divergence (MACD) indicator stays below zero, with a negative line at -445.81, suggesting bullish pressure is moderating after the recent rally rather than accelerating strongly.
On the topside, immediate resistance is defined by the horizontal barrier at $85,000, where a sustained break would likely open the way to fresh highs.
On the downside, initial support emerges near the 50-day EMA at $80,369, followed by the 100-day EMA at $76,641 and the 200-day EMA at $75,685, levels that should attract buyers on corrective dips as long as the broader bullish structure persists.
Ethereum rebounds after finding support around the $2,400 mark
Ethereum price trades at $2,509 on Wednesday, holding above its key EMAs and former trendline support, which keeps the near-term bias constructive. The 50-day EMA at $2,501 sits just beneath spot, reinforcing immediate underlying demand alongside the 100-day EMA at $2,355 and the 200-day EMA at $2,309.
However, momentum is subdued, with the RSI hovering near a neutral 44 and the MACD indicator well below zero, suggesting upside traction is fragile despite the supportive structure.
On the downside, initial support is located at the 50-day EMA around $2,501, followed by a short-term horizontal floor near $2,400 and the broken but still relevant rising trendline level around $2,256, before a more distant structural base emerges at $1,823.
On the topside, the next notable resistance is seen at the horizontal barrier around $2,770, where buyers would need to overcome overhead supply to extend the recovery; failure to do so would keep ETH consolidating above its cluster of daily EMAs rather than staging a clearer bullish continuation.
XRP stabilizes around key EMA clusters
XRP price trades at $1.371 on Wednesday, holding below the 200-day EMA at $1.379 and the 50-day EMA at $1.394, which keeps the near-term bias bearish despite the pair sitting above the 100-day EMA at $1.340.
The RSI at 42 leans soft but not oversold, while the MACD remains below zero, suggesting downside pressure still outweighs recovery attempts.
On the topside, initial resistance is seen at the 200-day EMA at $1.379, followed by the 50-day EMA at $1.394; a sustained break above these clustered averages would open the way toward the horizontal barrier at $1.540 and then $1.900.
On the downside, immediate support is defined by the 100-day EMA at $1.340, ahead of the horizontal floor at $1.300, where a decisive drop would reinforce the bearish tone and expose deeper retracement levels.