S&P 500 — US Large Cap Index
 FTSE 100 — UK Blue Chips
 Euro Stoxx 50 — Eurozone Leaders
 DAX 40 — German Equities
 CAC 40 — French Market Index
 Nikkei 225 — Japan Benchmark
 Hang Seng — Hong Kong Index
 Shanghai Composite — China Mainland
 ASX 200 — Australian Market
 TSX Composite — Canada Index
 Nifty 50 — India Large Cap
 STI Index — Singapore Market
 KOSPI — South Korea Index
 Bovespa — Brazil Equities
 JSE Top 40 — South Africa Index
 IPC Index — Mexico Market
Gold vs Bitcoin – Price Recovery gains traction after unexpected decline in NFP


- US Nonfarm Payrolls declined by 23K in July, falling short of the expected 80K growth.
- Gold records its best week since January, rising by more than 8% to $4,350 as weak US NFP trims rate hike bets.
- Bitcoin reclaims support above $65,000 as crypto market sentiment improves.
Gold (XAU/USD) is gaining momentum on Friday, trading above $4,350 after the United States (US) Bureau of Labor Statistics (BLS) released the Nonfarm Payrolls (NFP) report. Bitcoin (BTC) shows signs of a steady recovery above $65,000, buoyed by growing risk-on sentiment.
US Nonfarm Payrolls fall by 23K in July
The US NFP dropped by 23,000 in July, falling short of consensus forecasts of an 80,000 gain. This drop comes after June’s modest increase of 20,000, revised from the initial 57,000, highlighting a significant loss of momentum in the labor market.
Additional data from the report revealed the Unemployment Rate ticked down to 4.1% from 4.2% in June, while the Labor Force Participation Rate slipped to 61.4% from 61.5%.
Meanwhile, annual wage growth, tracked by Average Hourly Earnings, moderated to 3.2% annually, down from 3.4%, signaling softer wage pressure.
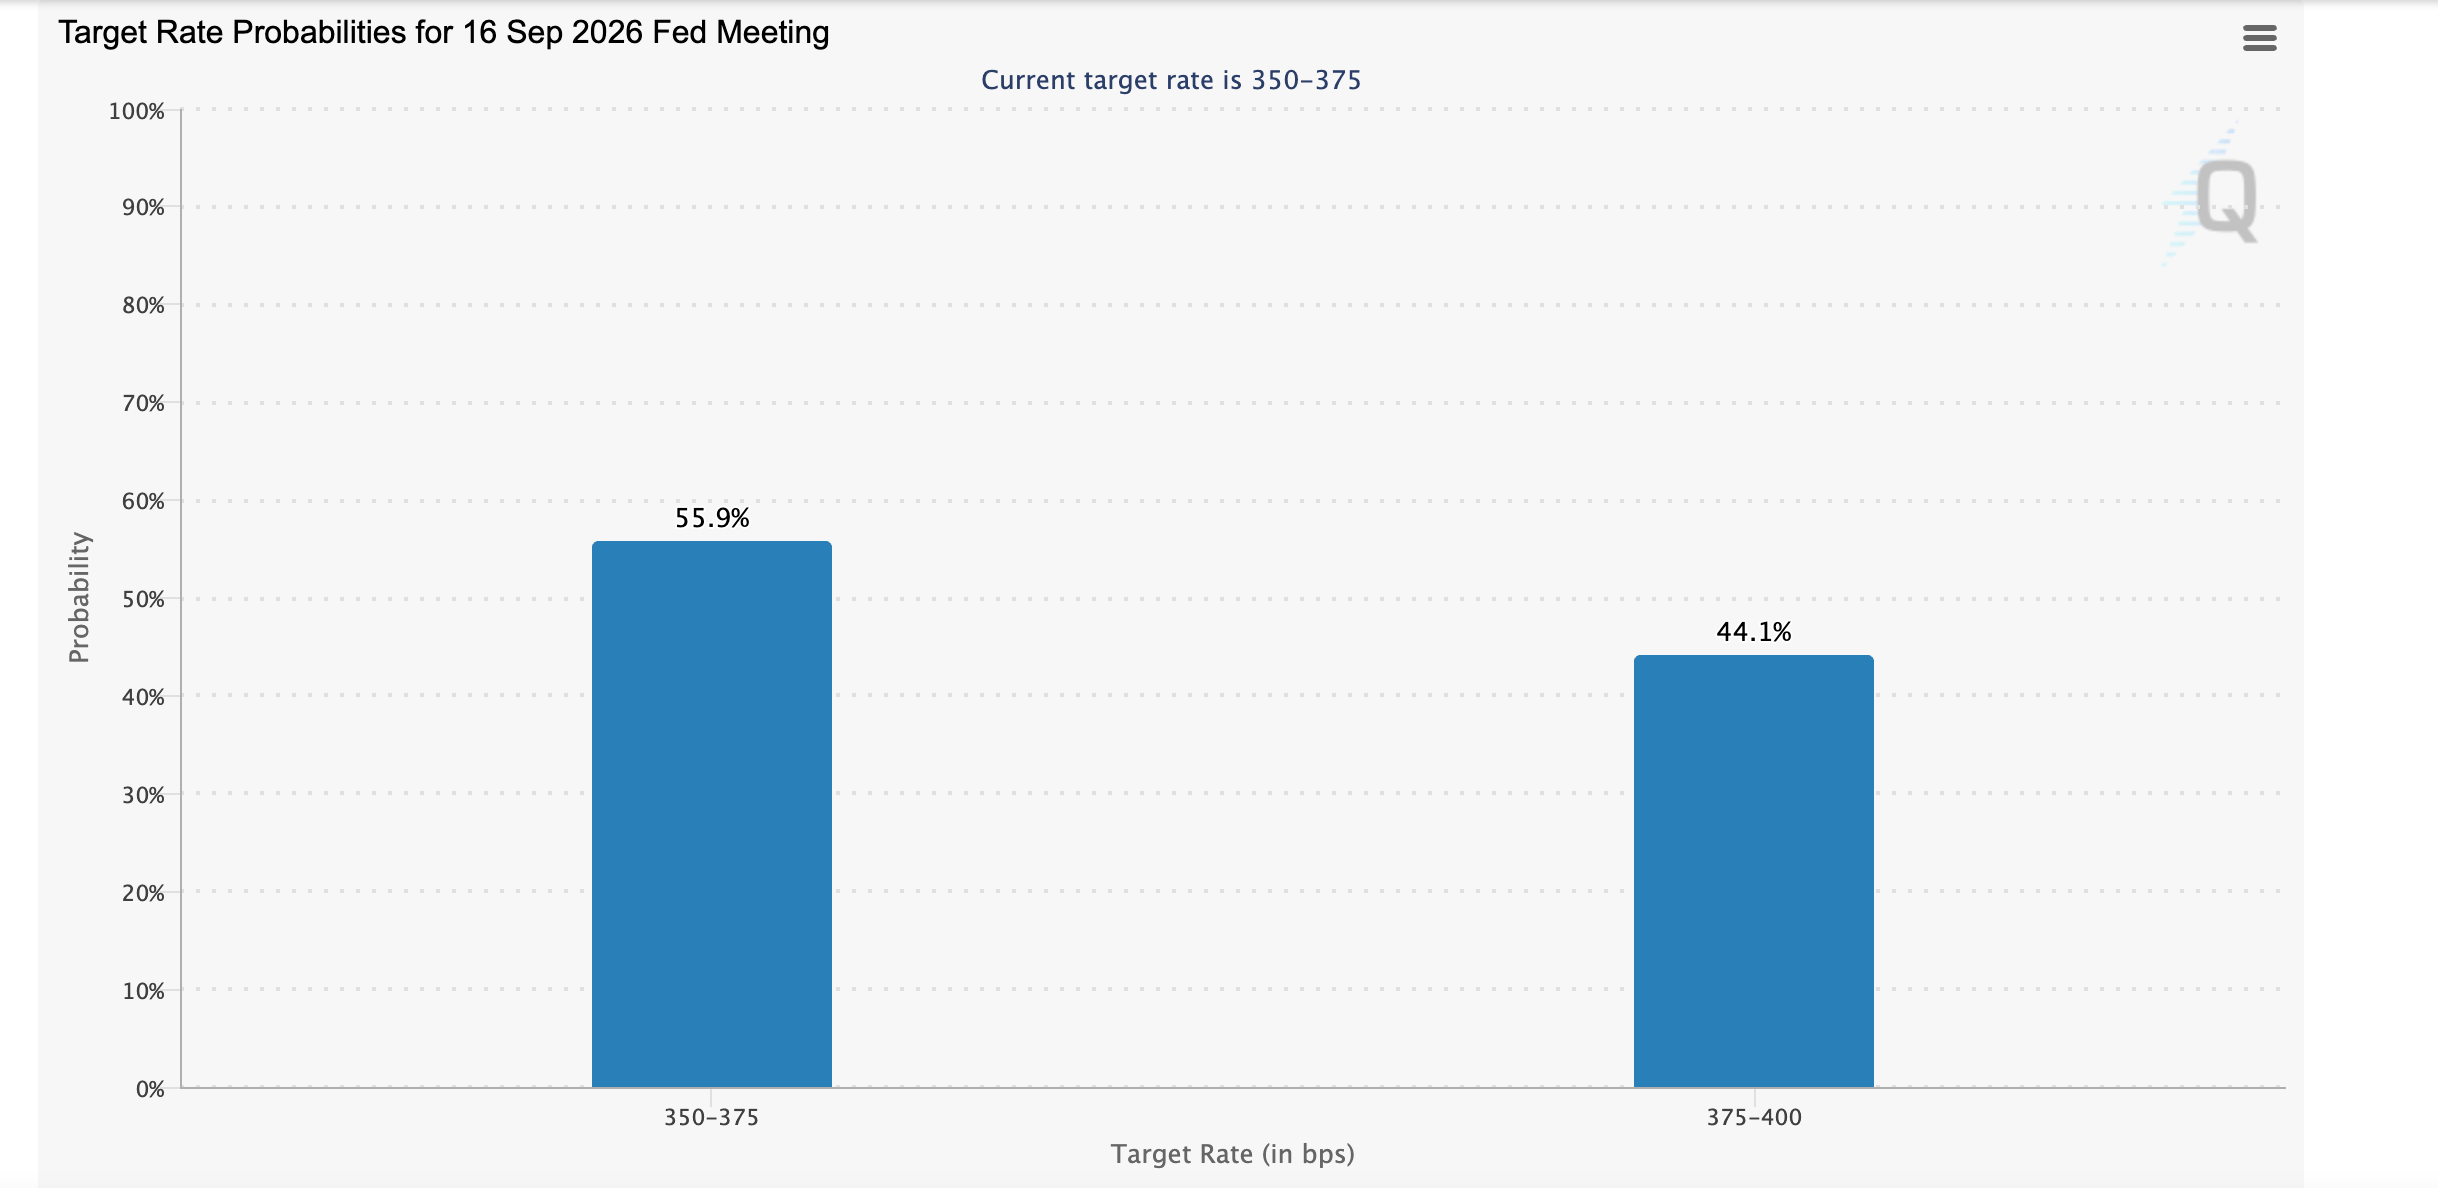
The CME FedWatch Tool shows a subsequent shift in monetary policy expectations. Market participants are now pricing in a 55.9% chance that the Federal Reserve (Fed) leaves interest rates unchanged in the 3.50%-3.75% range in September. Rate hike bets have moderated to 44.1%.
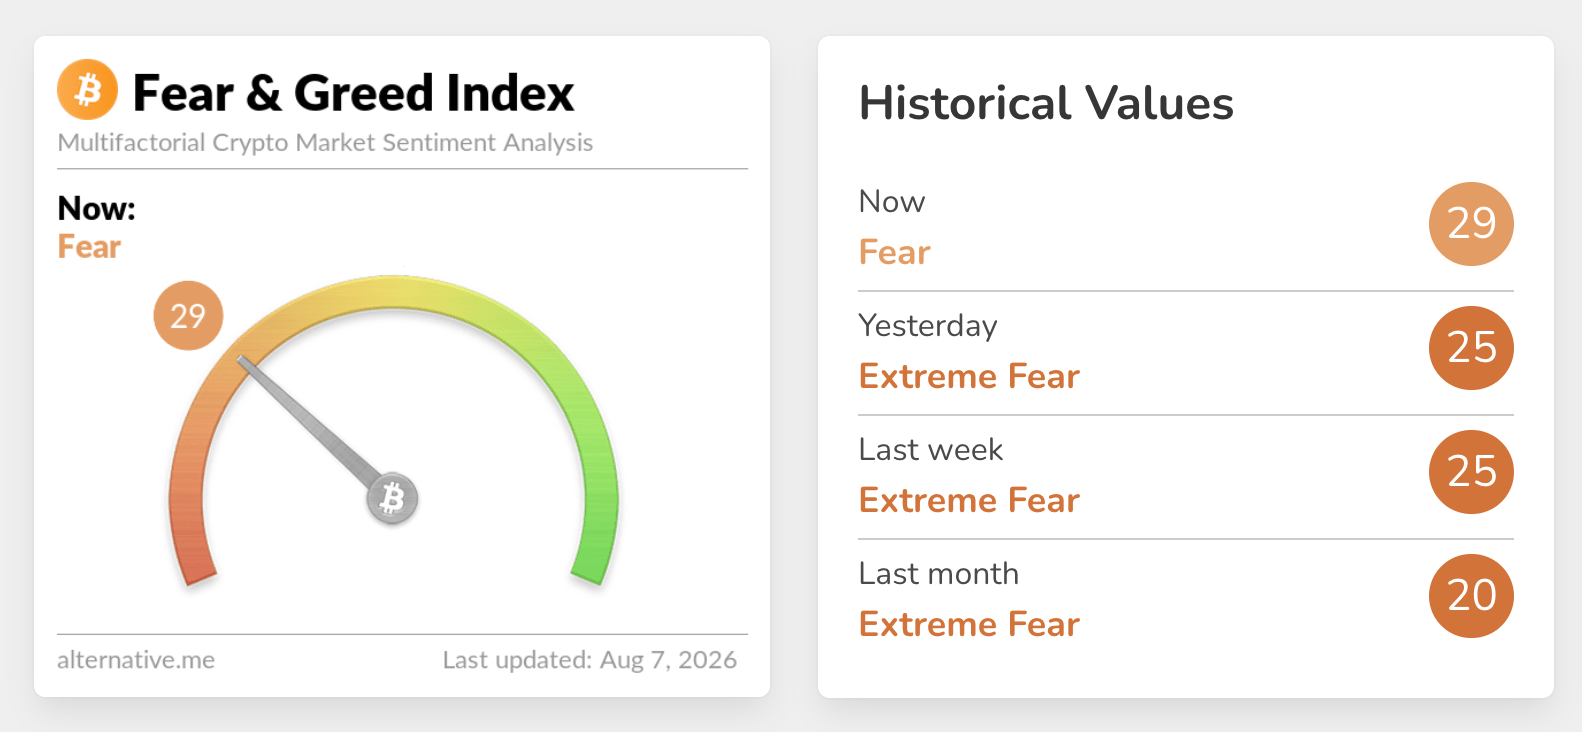
Meanwhile, risk appetite has improved but only marginally, with sentiment currently in the Fear territory at 29, up from 25 in the Extreme Fear territory on Thursday, according to the Fear & Greed Index. If sustained, strong sentiment would mean risk assets are attractive to investors, thus raising the odds of a sustained recovery.
Technical analysis: Bitcoin edges higher above $65,000
Bitcoin holds above the 50-day Exponential Moving Average (EMA) at $64,669 and the upward-sloping trendline support near $62,921, which keeps the near-term bias moderately bullish despite the broader consolidation. The Parabolic SAR at $62,275 reinforces the underlying demand, while the Relative Strength Index (RSI) around 55 on the daily chart and a mildly positive Moving Average Convergence Divergence (MACD) reading hint that buyers still retain control, although upside momentum appears measured rather than impulsive.
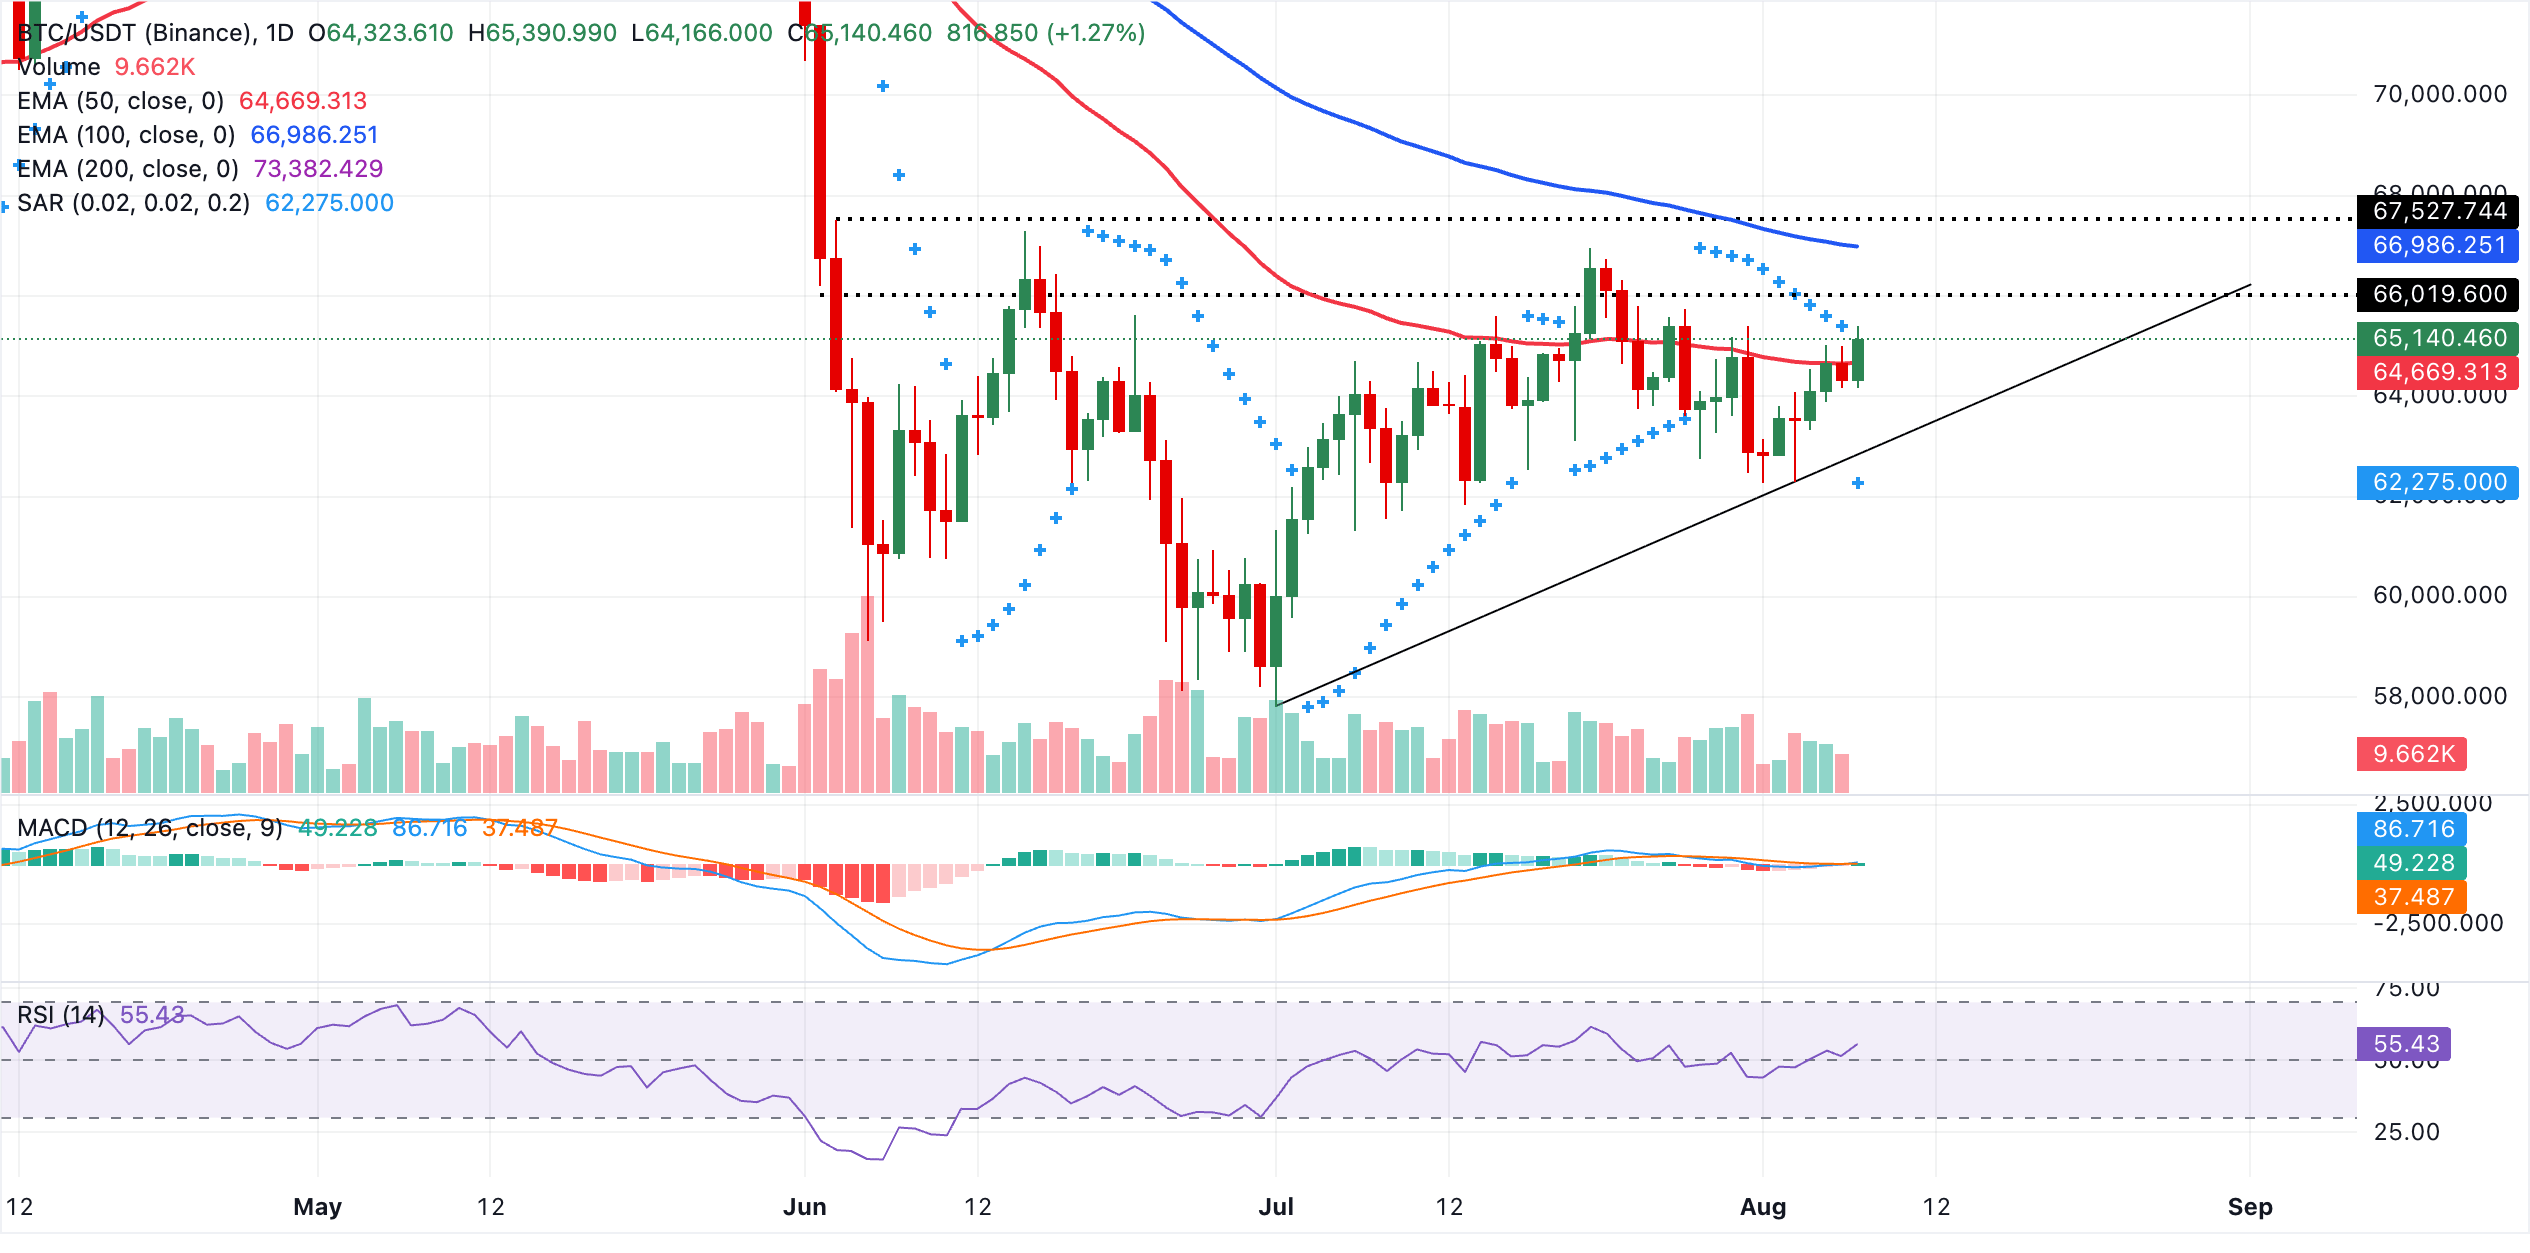
Immediate support lies at the recent pivot around $65,000, followed by the 50-day EMA at $64,669 and then the rising trendline near $62,921, ahead of the Parabolic SAR level at $62,275. On the flip side, initial resistance emerges at the 100-day EMA at $66,986, with a more significant barrier at the 200-day EMA around $73,382, where a sustained break would be needed to reopen a stronger bullish extension in the days ahead.
Technical outlook: Gold climbs as buyers tighten grip
Gold holds a constructive near-term bias as it remains above the 50-week, 100-week and 200-week EMAs at $4,215, respectively, and has broken above the prior downward resistance trendline now offering support near $4,060.
Still, upside progress is tempered by the Parabolic SAR at $4,441 acting as immediate resistance, while the Moving Average Convergence Divergence (MACD) remains below zero with a negative reading and the RSI hovering around the neutral 50 mark, hinting at a consolidative rather than impulsive bullish tone.
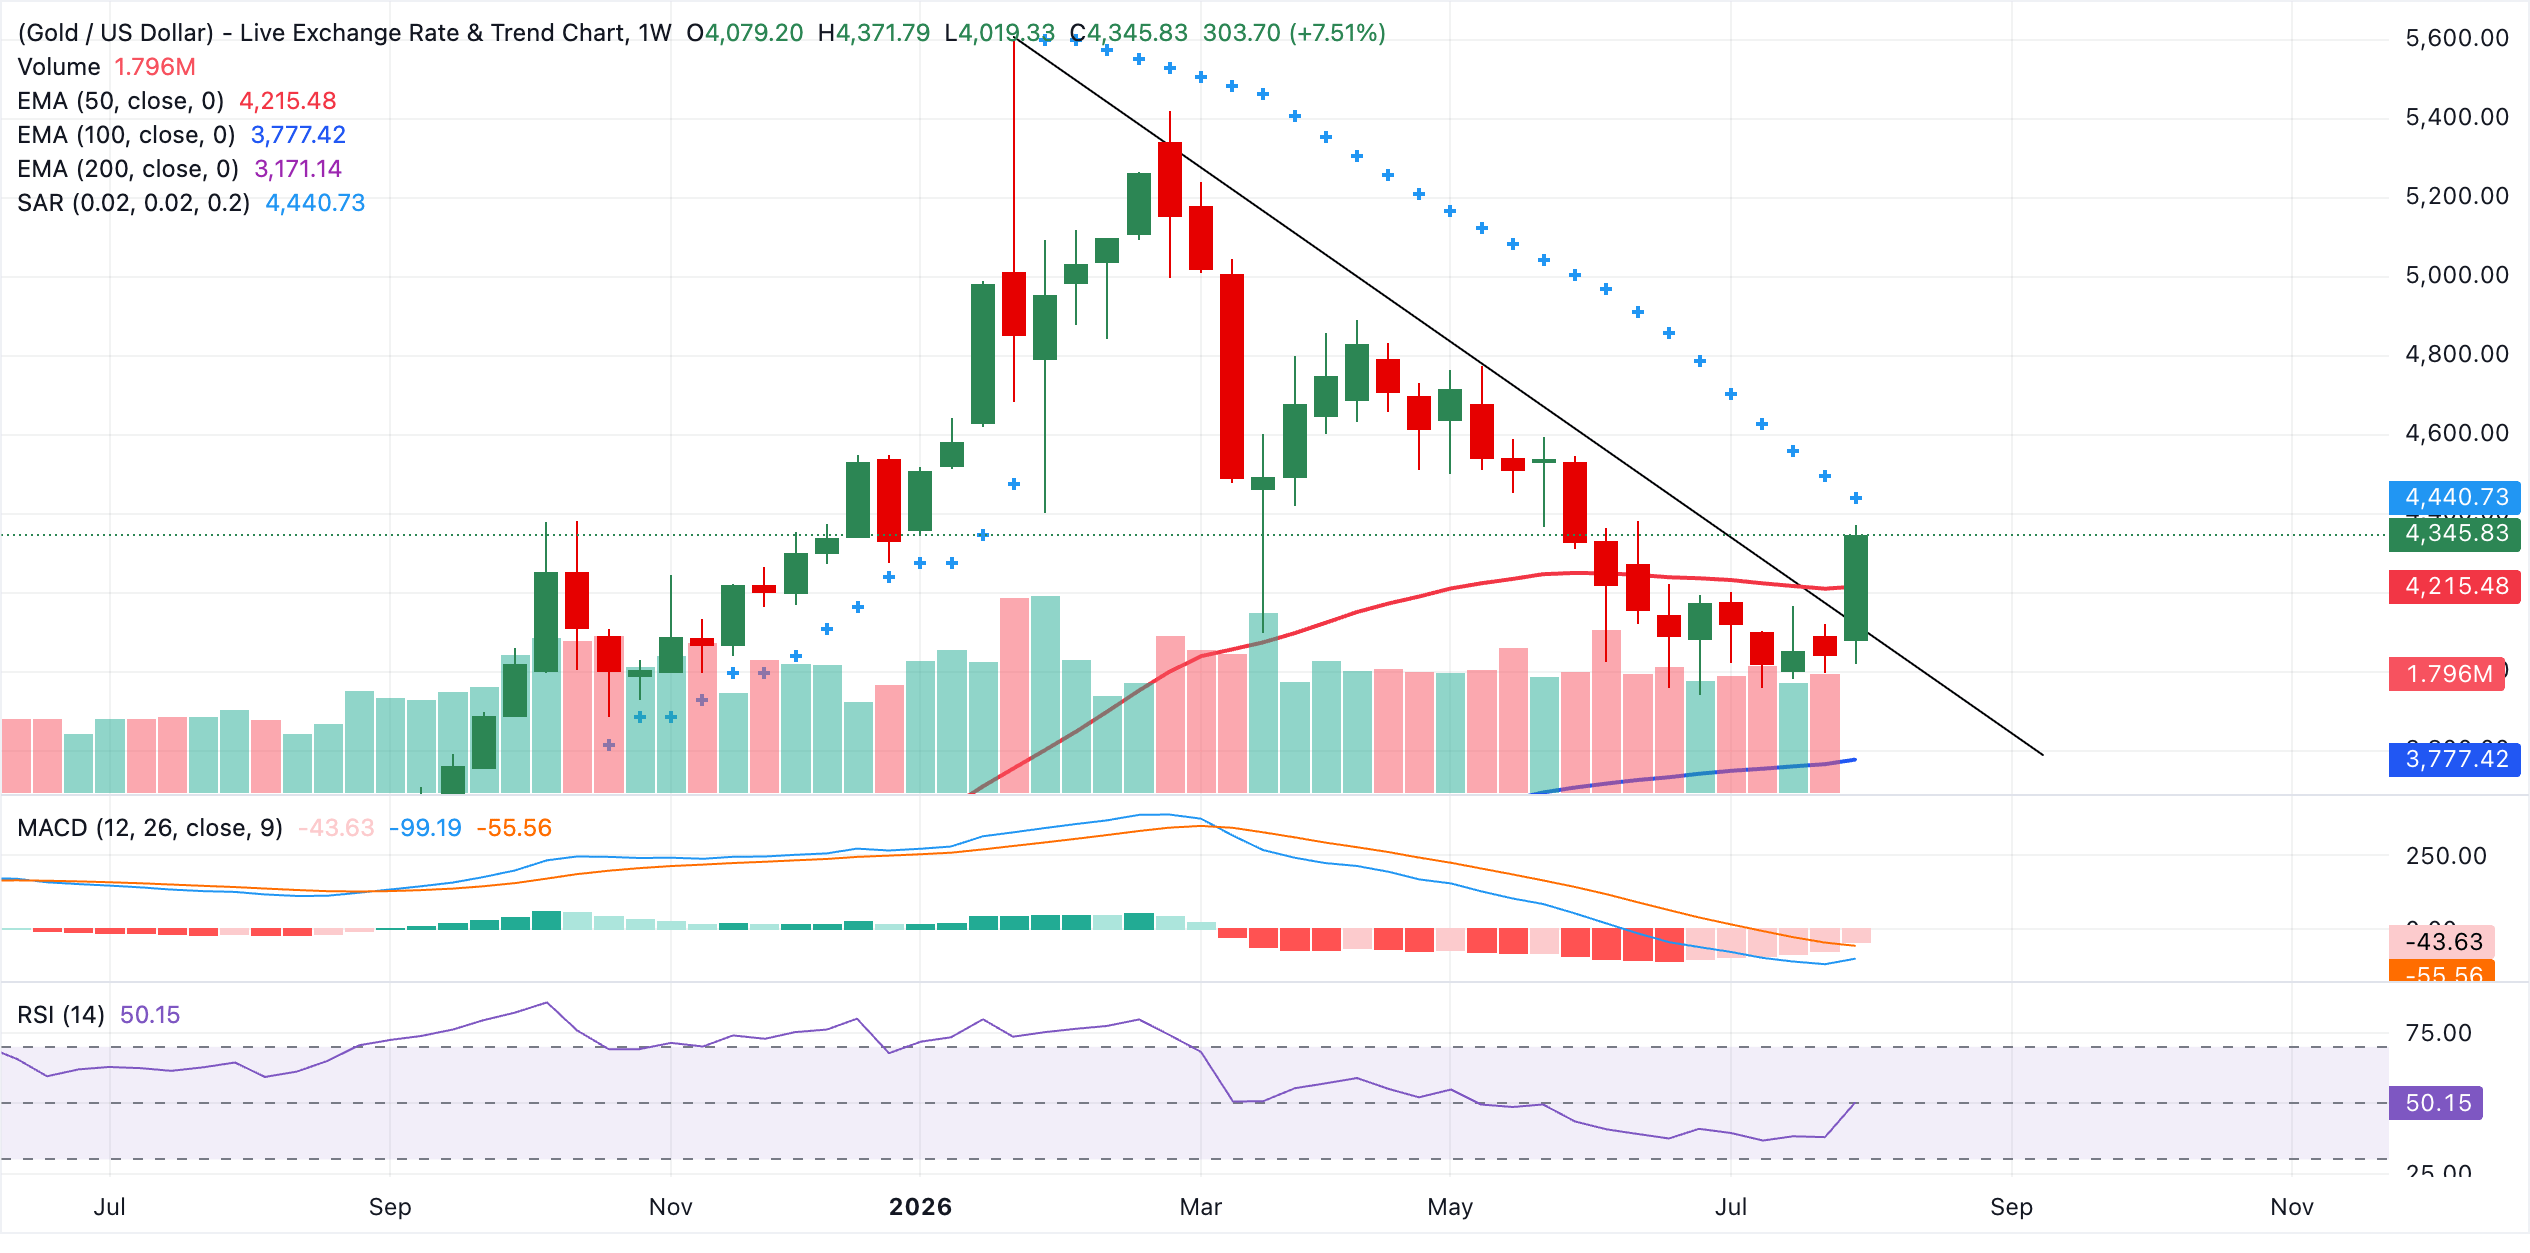
On the topside, initial resistance is defined by the Parabolic SAR at $4,441, where a sustained break would open the way for a more decisive advance. On the downside, the first layer of support lies at the broken trendline barrier turned floor around $4,060, followed by dynamic support at the 50-week EMA at $4,215 and deeper medium-term cushions at the 100-week EMA at $3,777, levels that collectively reinforce the broader bullish structure as long as they remain intact.