S&P 500 — US Large Cap Index
 FTSE 100 — UK Blue Chips
 Euro Stoxx 50 — Eurozone Leaders
 DAX 40 — German Equities
 CAC 40 — French Market Index
 Nikkei 225 — Japan Benchmark
 Hang Seng — Hong Kong Index
 Shanghai Composite — China Mainland
 ASX 200 — Australian Market
 TSX Composite — Canada Index
 Nifty 50 — India Large Cap
 STI Index — Singapore Market
 KOSPI — South Korea Index
 Bovespa — Brazil Equities
 JSE Top 40 — South Africa Index
 IPC Index — Mexico Market

Oil falls 2% to its lowest level since late August. What’s next?

Brent crude prices (OIL) are falling sharply as signs emerge that the risk of further escalation in the U.S.–Iran conflict may be easing. Brent futures have retreated toward $90 per barrel, while WTI has fallen to around $84.5, marking the lowest levels since late August. The market is primarily unwinding the geopolitical risk premium that had built up in recent weeks and continues to price in a gradual de-escalation of tensions between the U.S. and Iran.
- Donald Trump said that further military action against Iran does not appear necessary “at this point,” while Al Arabiya sources reported yesterday that there may have been progress in negotiations with Iran, which was said to have agreed to a uranium enrichment limit of 3.67%.
- Improving oil flows through the region are adding further downward pressure on prices. The outlook remains uncertain, however, as regional negotiations are still fragile and risks to energy infrastructure have not disappeared. Tehran said yesterday that the issue of removing enriched uranium from Iran could not even be considered for discussion.
- At the same time, the first trilateral talks since February 2026 involving Ukraine, Russia and U.S. mediators are taking place in Abu Dhabi. Any positive signals from the talks, while still appearing unlikely, could add further downward pressure on oil prices.
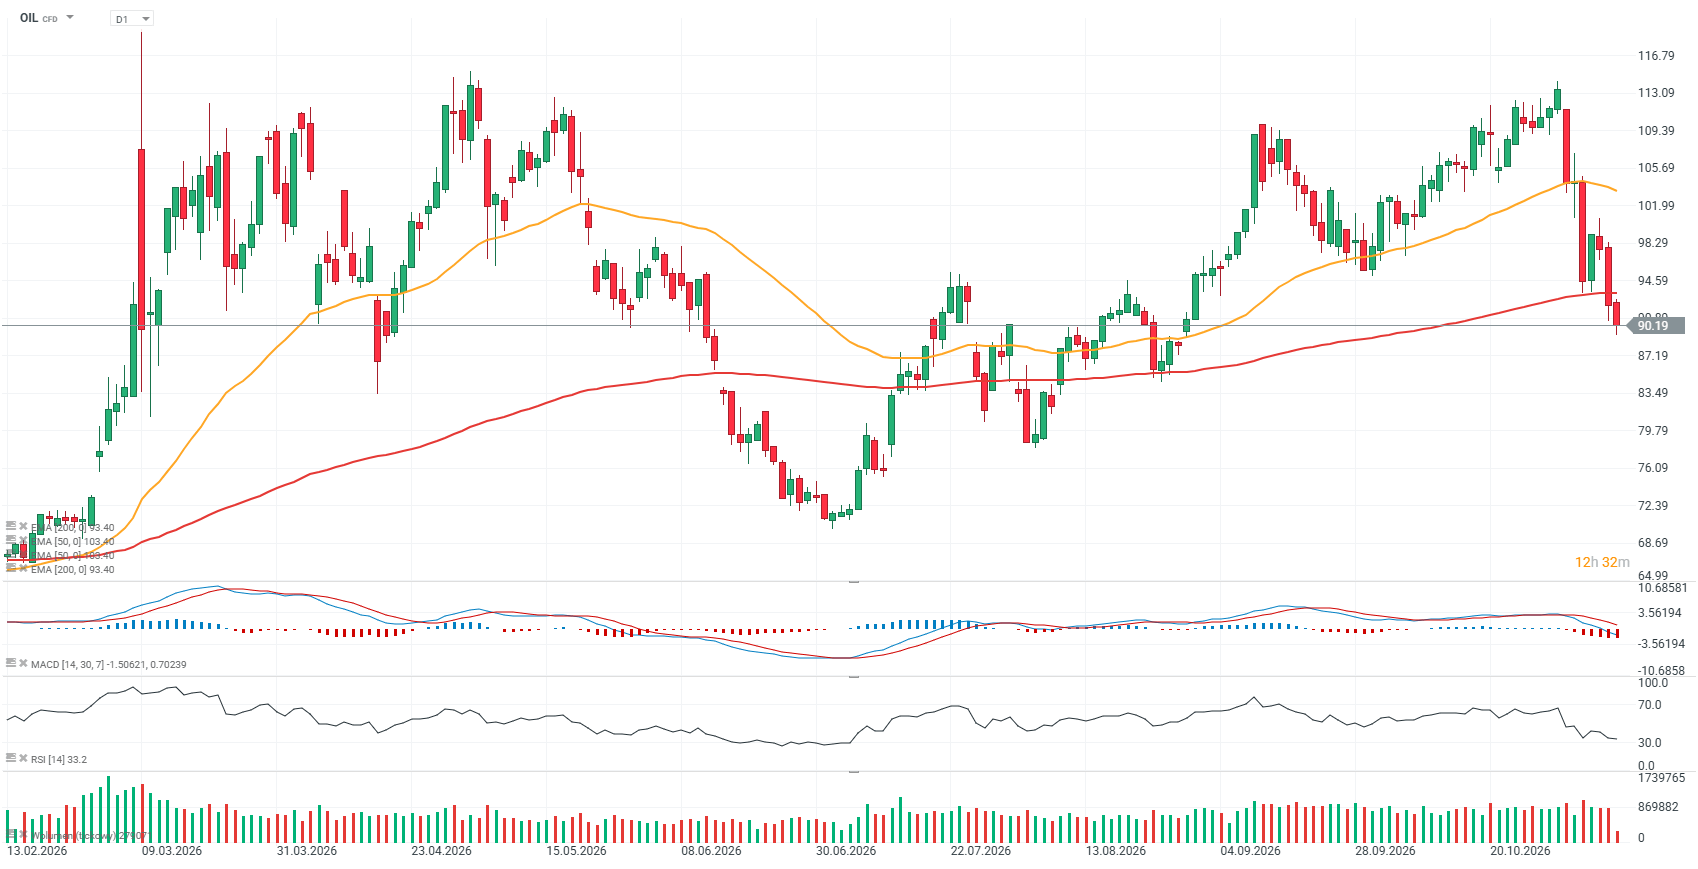
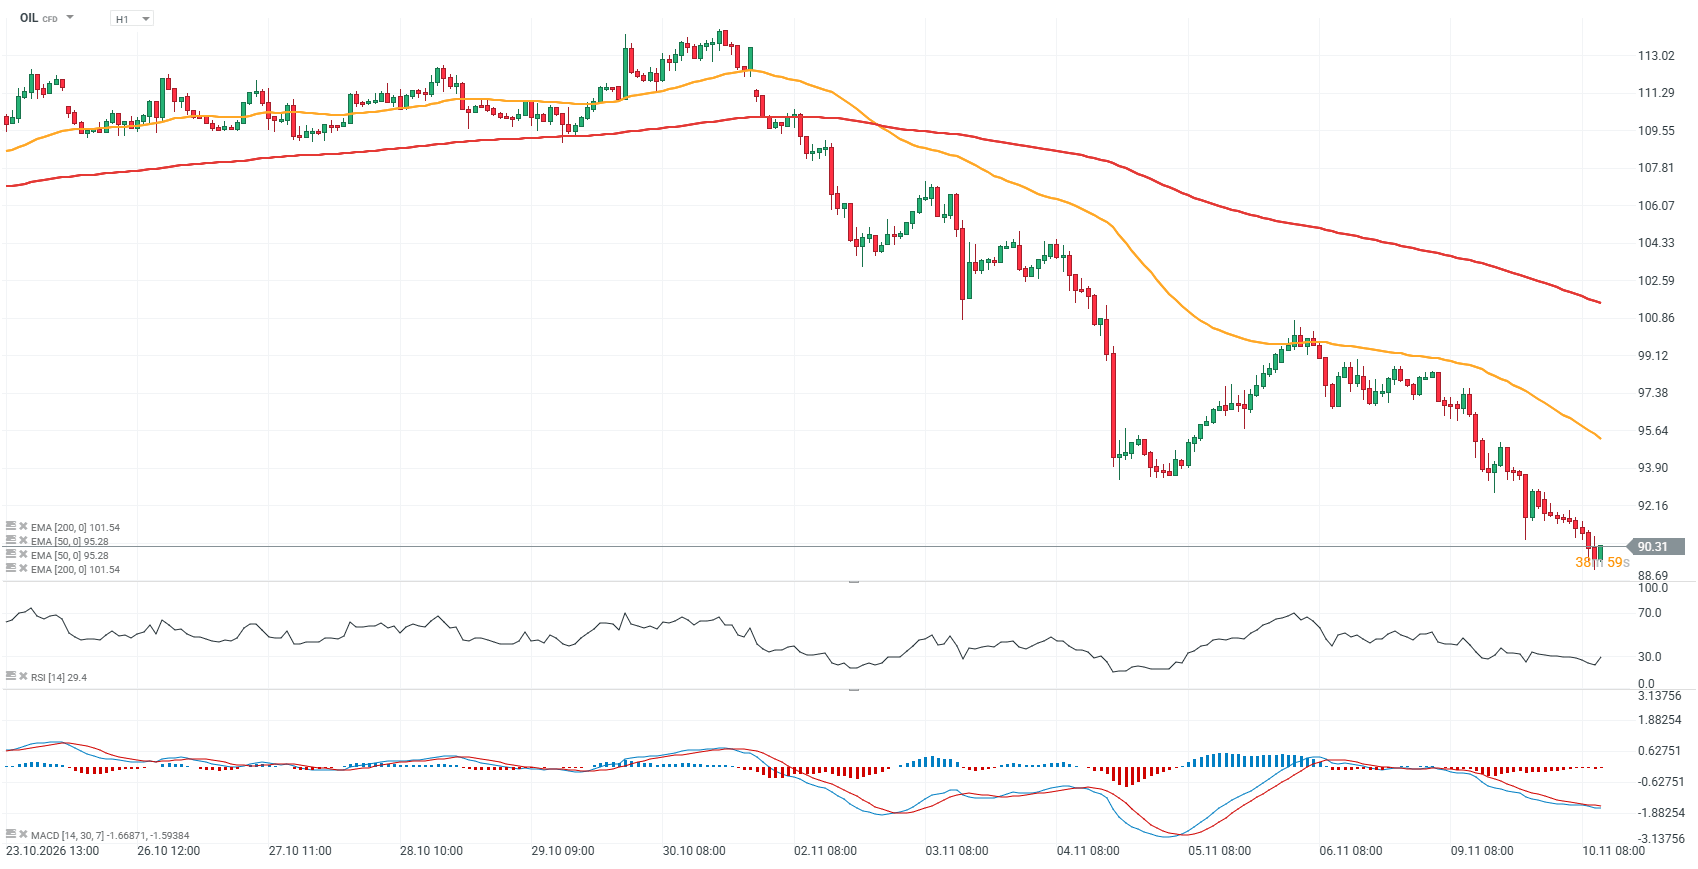
OIL chart (D1, H1 intervals)
Oil recently closed a session below the EMA200 (red line) for the first time since early August 2026. Key support levels are now around $85, where price reactions were visible around the turn of August and September, and the $78–80 area, which corresponds to local August lows. A stronger bearish impulse could therefore open the way to an additional decline of roughly 10% from current levels. The key resistance levels are around $94.5, where price reactions were seen at the beginning of last week, and the psychologically important $100 area, where the latest rally was halted last Friday.
Source: xStation5
Source: xStation5
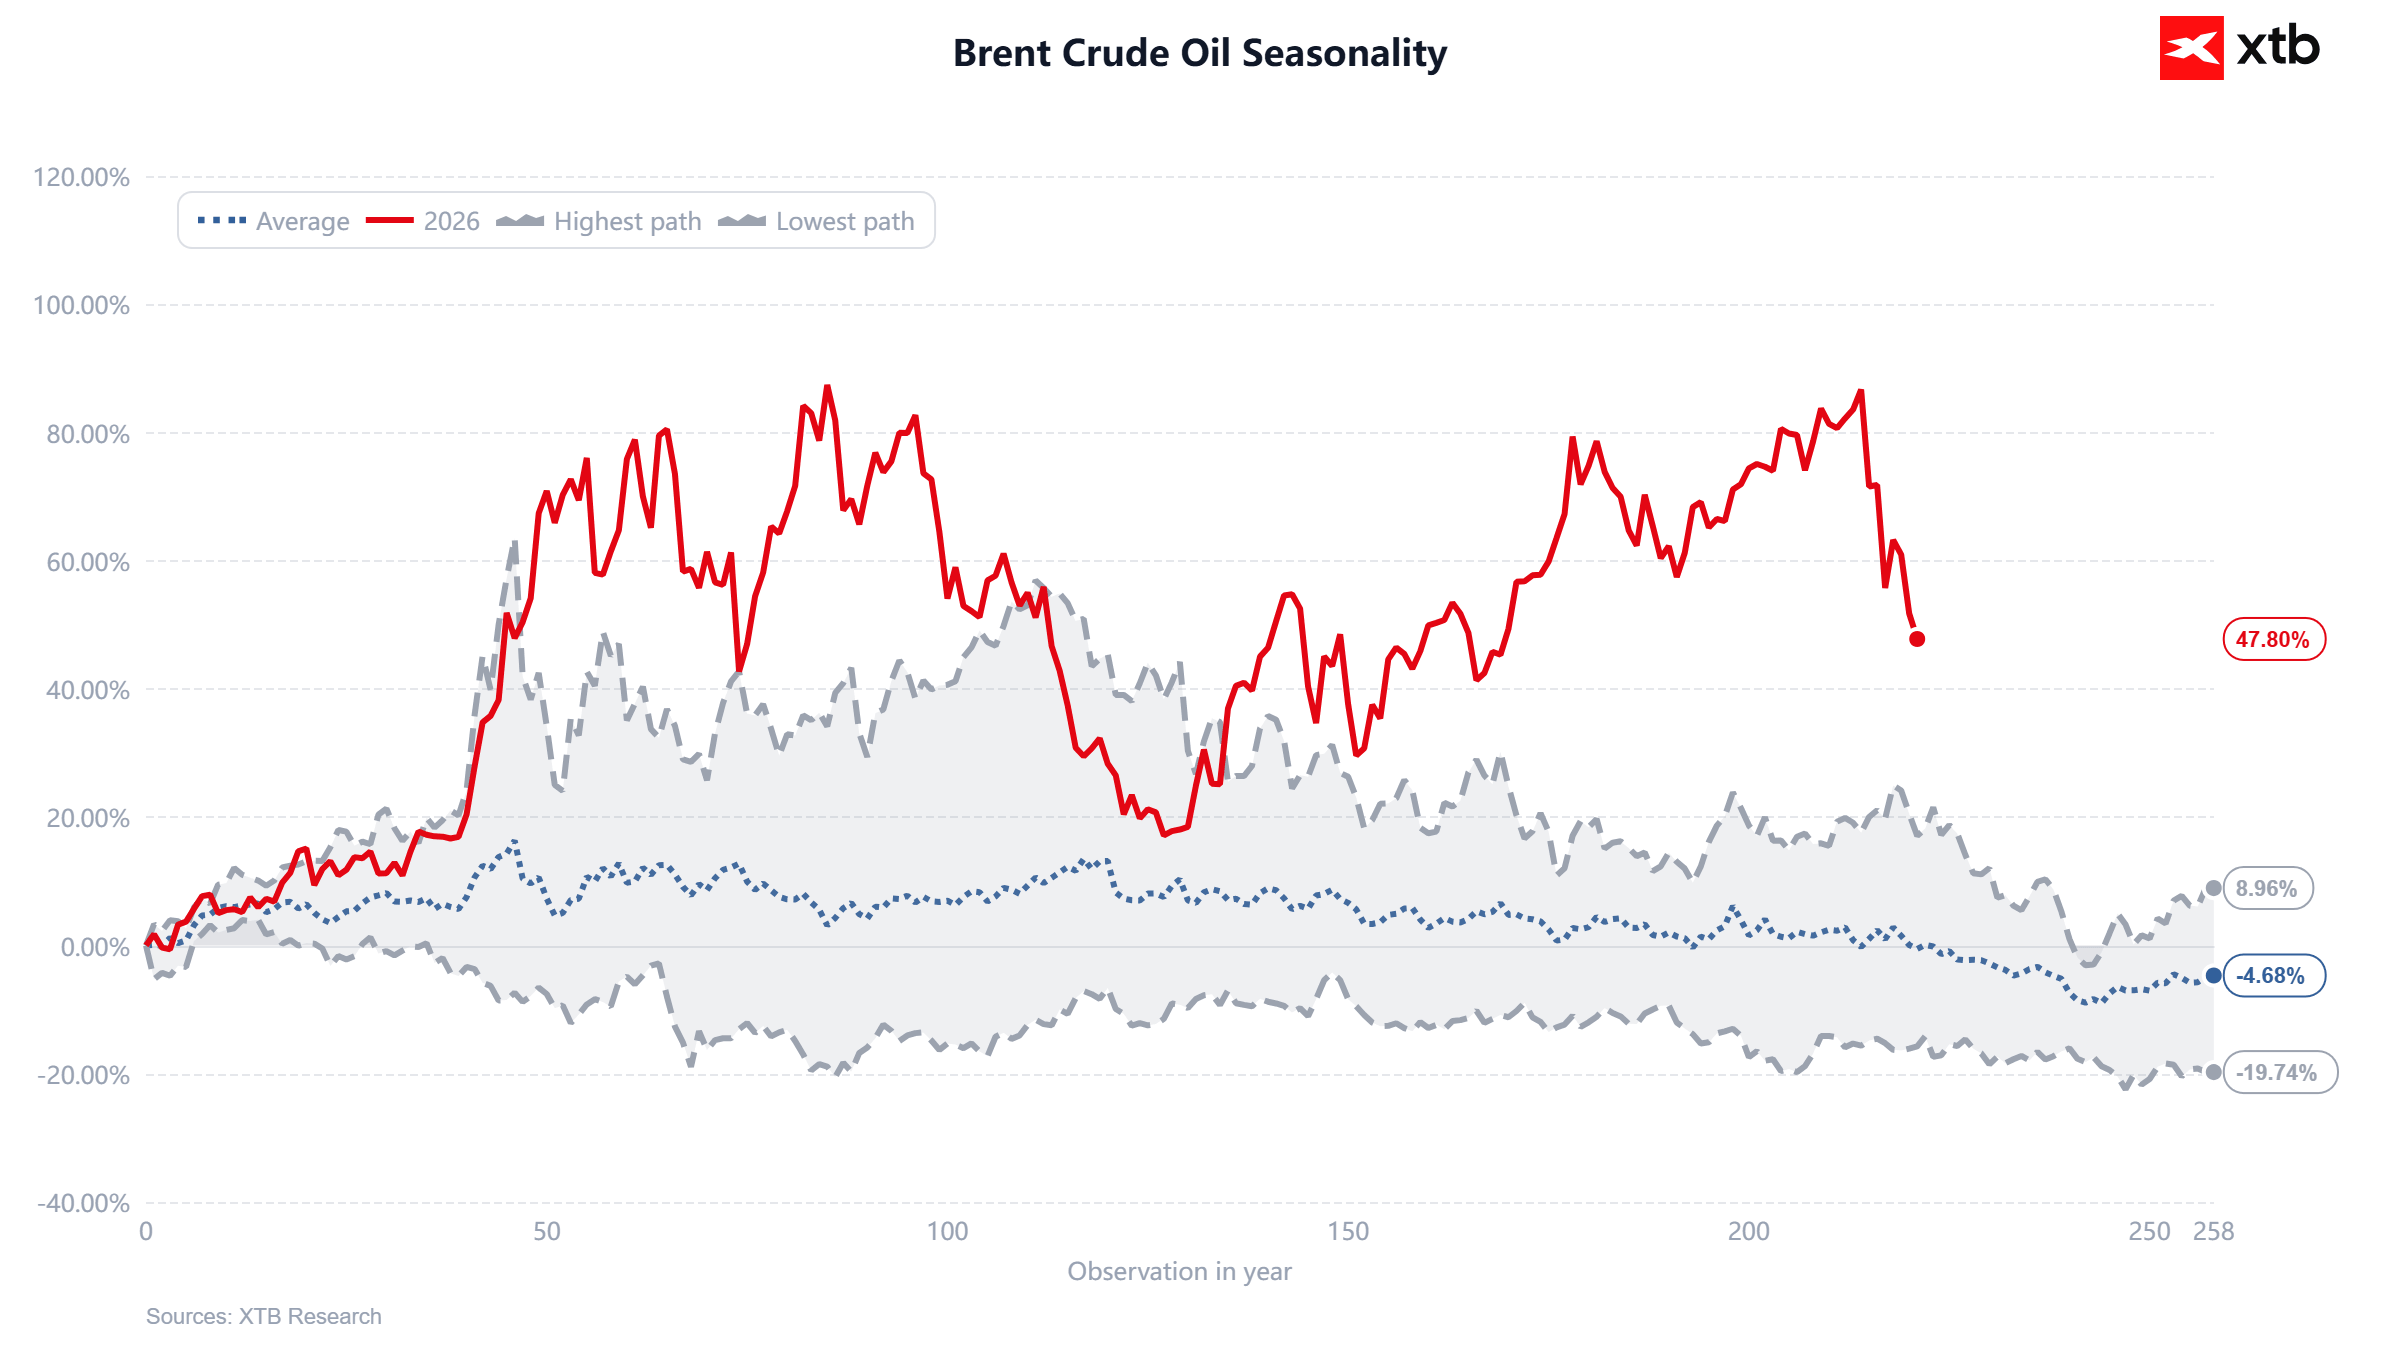
Brent crude oil seasonality
Brent’s 2026 path has been exceptionally strong relative to its historical seasonal pattern, with the year-to-date gain still close to 48% despite the recent pullback. That leaves this year far above the long-term average path, which is slightly negative at this stage of the calendar, and even above the strongest historical path currently shown near 9%. The message is that 2026 has not been a normal seasonal year; geopolitics and supply-risk premia have dominated the usual cyclical pattern. At the same time, the sharp decline from the recent peak shows how quickly those premia can unwind once the market starts pricing de-escalation. Seasonality therefore offers only limited protection from further downside if political risk continues to fade and physical flows normalize. From here, the crucial question is whether Brent converges back toward its historical range or whether another supply shock keeps 2026 as an extreme outlier.
Source: XTB Research
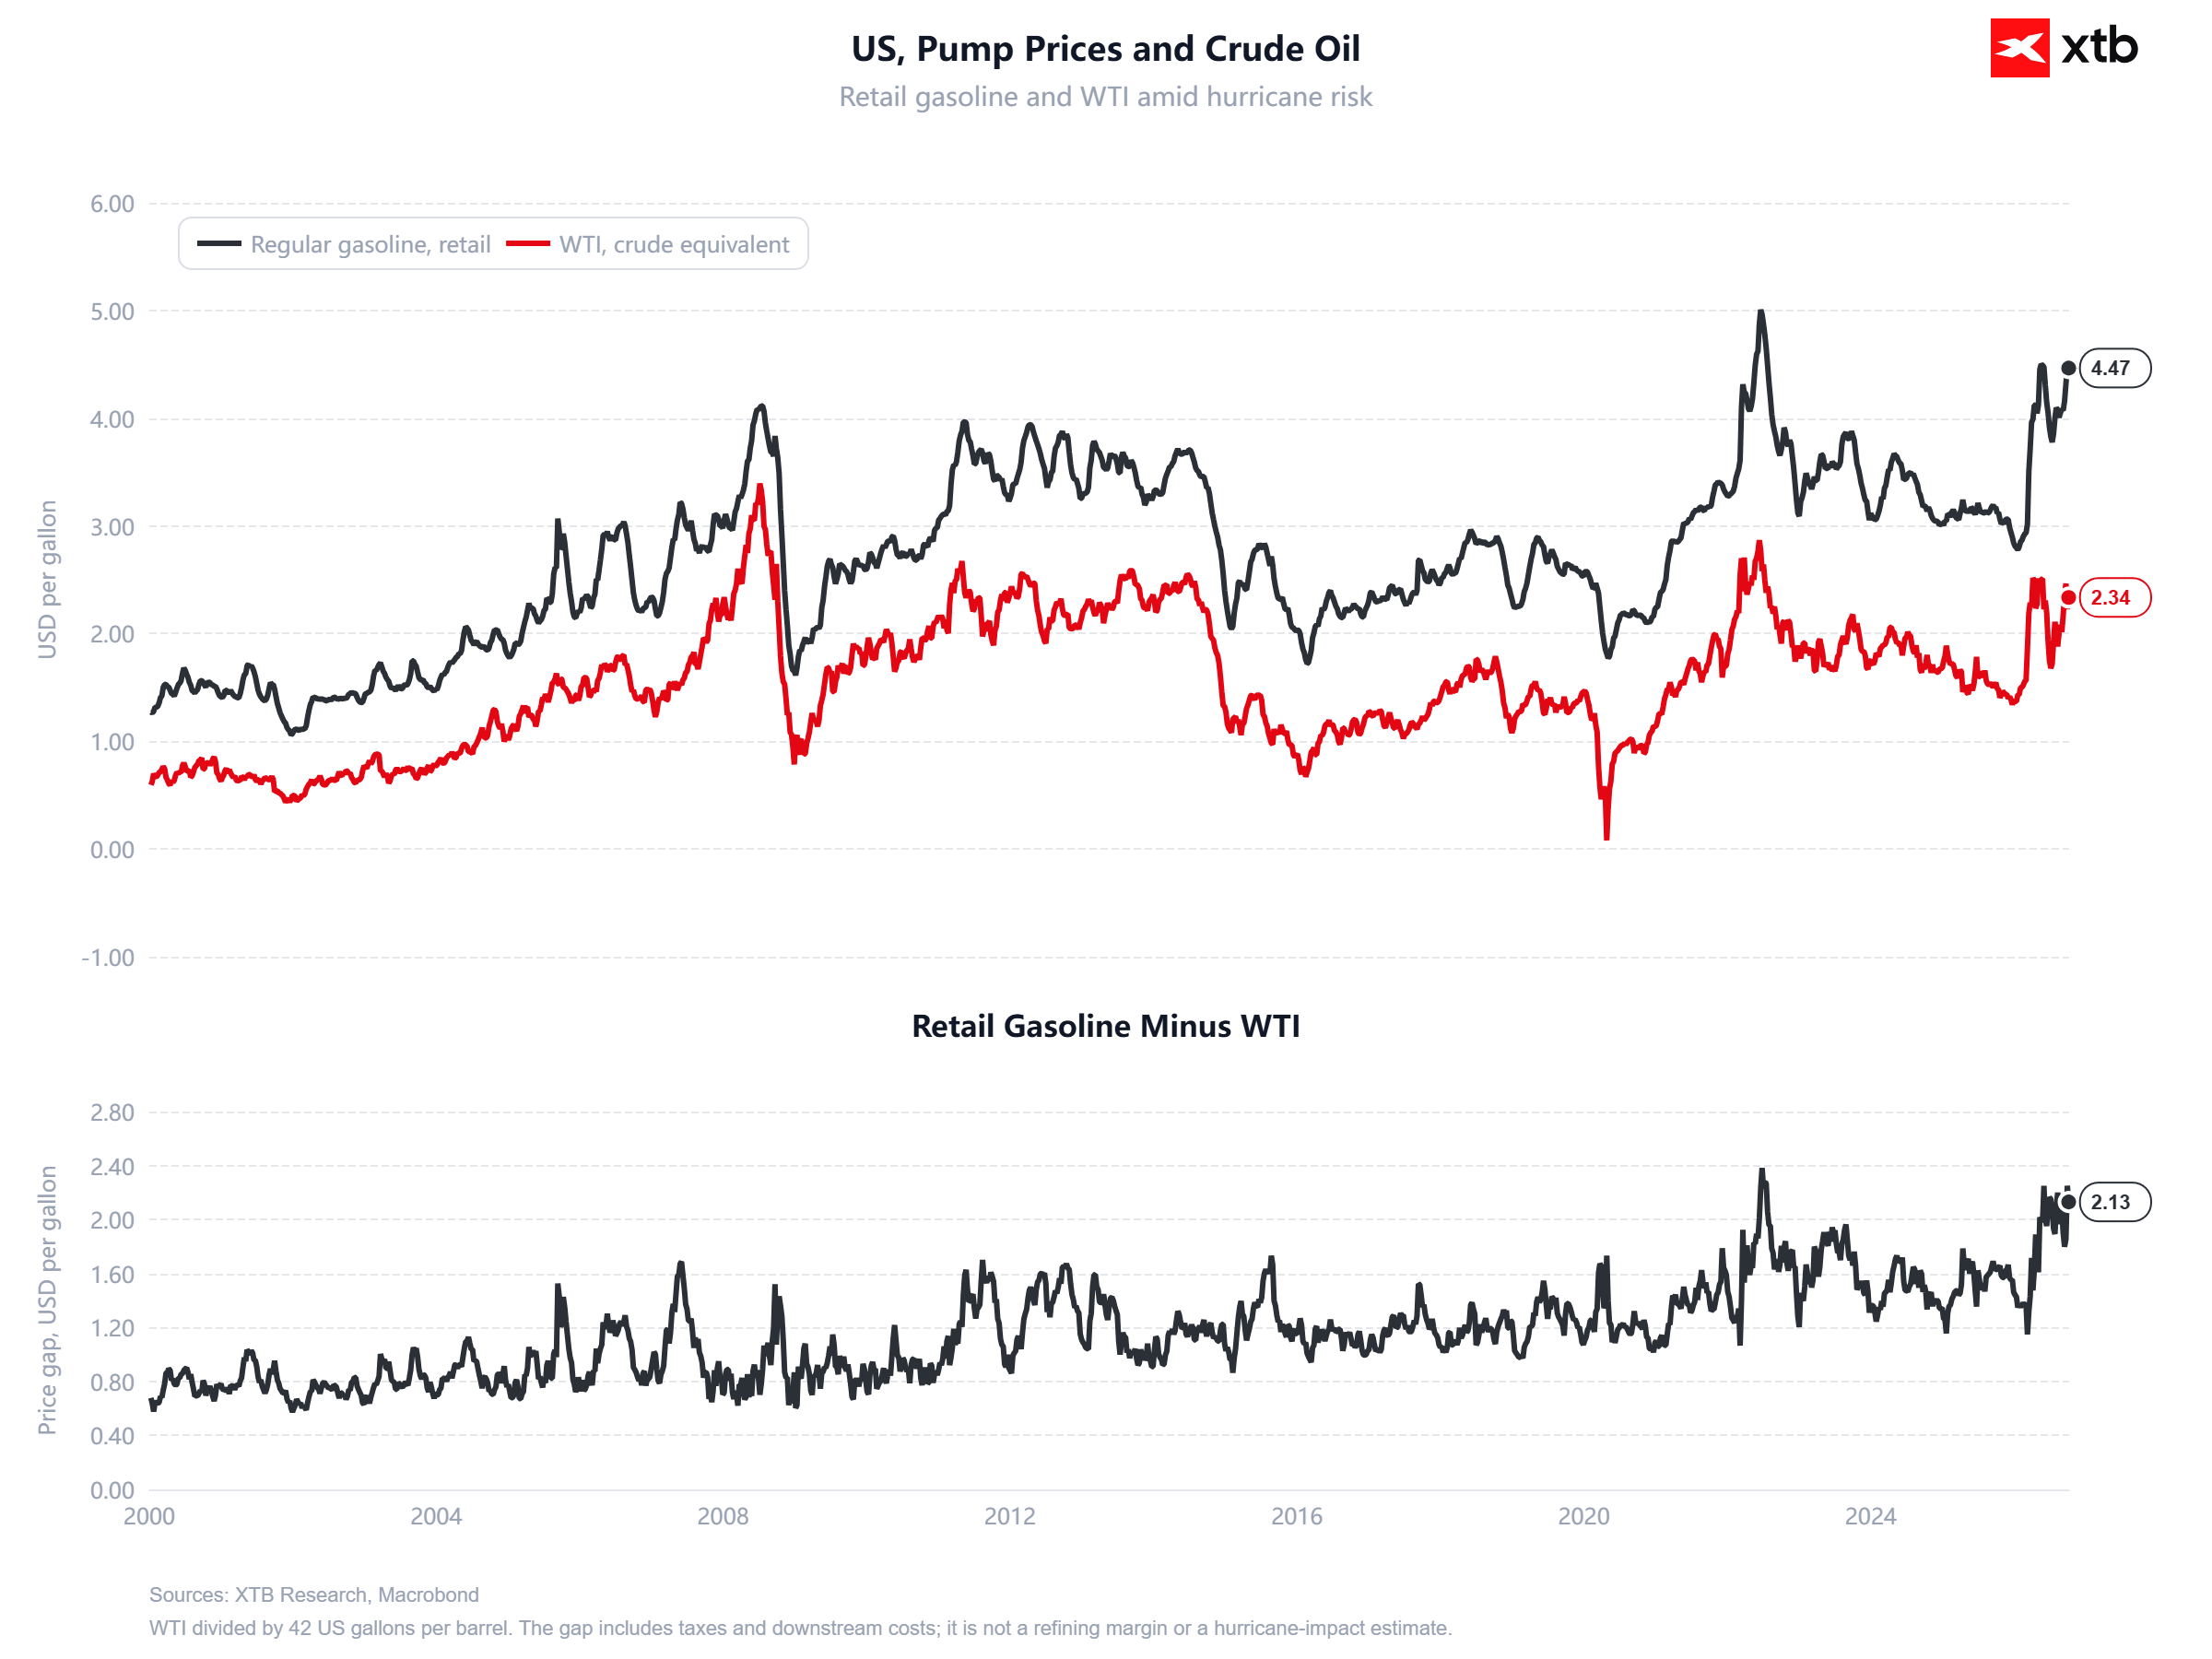
US pump prices and crude oil
The chart shows that the gap between U.S. retail gasoline prices and the crude-oil equivalent has widened to unusually high levels, with gasoline near $4.47 per gallon versus roughly $2.34 for the WTI-equivalent component. That spread, around $2.13 per gallon, is well above the levels seen through most of the post-2000 period and points to the growing importance of taxes, refining, distribution and retail margins in the final price paid by consumers. In other words, lower crude prices do not automatically translate into an equally large decline at the pump, especially when downstream bottlenecks or regional disruptions are present. The recent divergence also suggests that consumers may continue to feel elevated fuel costs even as the oil market itself softens. For macro markets, that matters because gasoline prices feed directly into inflation expectations and household sentiment. The key signal now is whether the gap begins to compress; if it does, the disinflationary impact of lower crude could become much more visible in headline CPI.
Source: XTB Research