S&P 500 — US Large Cap Index
 FTSE 100 — UK Blue Chips
 Euro Stoxx 50 — Eurozone Leaders
 DAX 40 — German Equities
 CAC 40 — French Market Index
 Nikkei 225 — Japan Benchmark
 Hang Seng — Hong Kong Index
 Shanghai Composite — China Mainland
 ASX 200 — Australian Market
 TSX Composite — Canada Index
 Nifty 50 — India Large Cap
 STI Index — Singapore Market
 KOSPI — South Korea Index
 Bovespa — Brazil Equities
 JSE Top 40 — South Africa Index
 IPC Index — Mexico Market

What’s Next for the S&P 500? – U.S. Earnings Season Recap


The Q3 2026 earnings season on Wall Street remains clearly stronger than the market had expected, although the magnitude of the beats has been relatively modest, suggesting that the bar for this quarter had already been set quite high. With 88% of S&P 500 companies having reported, both the breadth of positive surprises and the pace of earnings growth point to strong underlying fundamentals across U.S. corporates. At the same time, index valuations have declined materially relative to multi-year averages, improving the relationship between earnings growth and valuation multiples.
- According to FactSet, 84% of S&P 500 companies that have reported Q3 results have beaten EPS expectations, while 74% have delivered a positive revenue surprise.
- Earnings growth for the index currently stands at 31.4% year over year. If this level holds through the end of the reporting season, it would mark the third consecutive quarter in which EPS growth exceeded 25%.
- As recently as September 30, the market had expected Q3 earnings growth of 29.1% year over year. The current 31.4% figure therefore represents a clear positive revision during the reporting season.
- All 10 sectors reporting results are now showing stronger earnings growth than expected at the end of September, reflecting both upward EPS revisions and better-than-expected actual results.
- The outlook for Q4 remains relatively constructive: 43 S&P 500 companies have issued positive EPS guidance, while 32 have issued negative guidance.
- The S&P 500 forward 12-month P/E ratio currently stands at 17.7, below the 5-year average of 19.8 and the 10-year average of 19.1.
- The magnitude of earnings surprises is less impressive, however. Earnings are currently only 2.7% above expectations on average, compared with a 1-year average of 13.8%, a 5-year average of 7.5% and a 10-year average of 8.0%. This is the lowest level since Q4 2022. By contrast, the gap between reported revenues and expectations is above 2% and sits slightly above both short- and long-term historical averages.
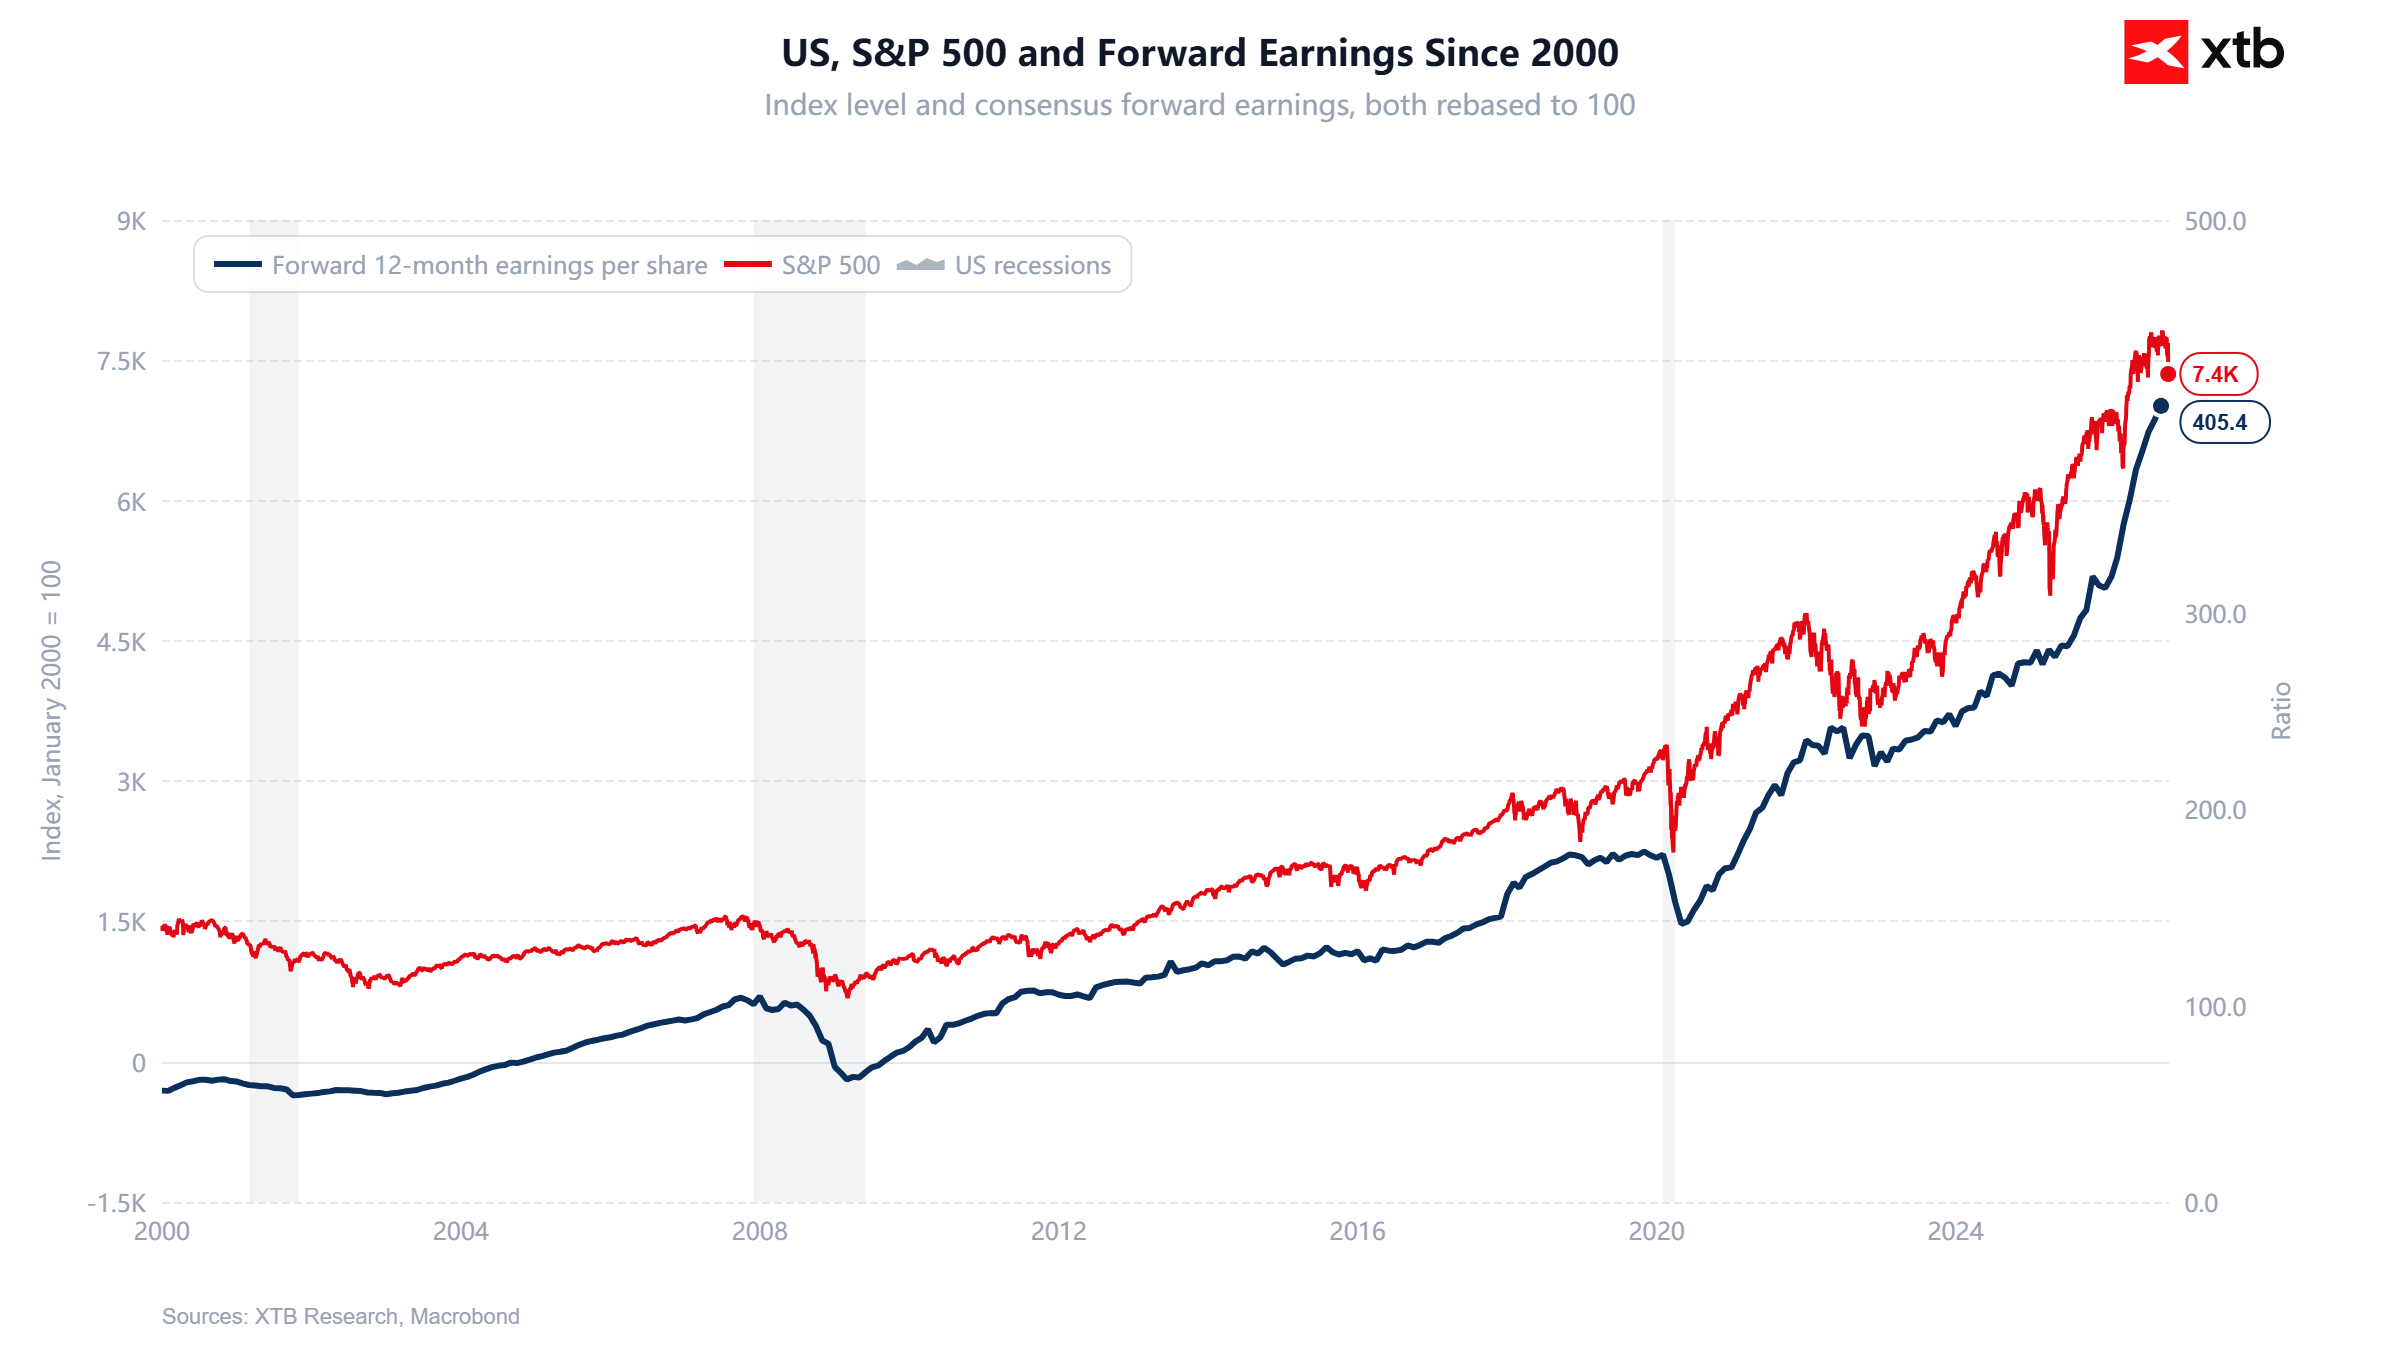
Source: XTB Research, Macrobond
S&P 500 valuation falls to its lowest level in more than three years
The S&P 500 forward 12-month P/E ratio fell to 17.7 on November 5, its lowest level since November 1, 2023, when it stood at 17.5. The multiple remains clearly below the 5-year average of 19.8 and the 10-year average of 19.1, but it is still above the longer-term averages of 17.6 for 15 years, 16.5 for 20 years and 16.4 for 25 years. Notably, the Information Technology sector’s forward P/E ratio is now at its lowest level since March 23, 2020. The main driver behind the decline in the multiple has been the very strong rise in expected earnings. Since the end of 2025, the S&P 500 has gained 7.4%, while the forward 12-month EPS estimate has increased by as much as 33.6%, meaning the denominator in the P/E ratio has grown much faster than the index price. At the sector level, Information Technology and Energy stand out, with valuations now below even their respective 25-year averages.
- S&P 500 forward P/E: 17.7; the lowest level over the past 25 years was 8.6 on November 20, 2008, while the 2022 bear-market trough was around 15
- Information Technology: 17.3 versus a 25-year average of 20.0
- Energy: 11.7 versus a 25-year average of 13.9
S&P 500 earnings season confirms very strong profit growth
With 88% of S&P 500 companies having reported Q3 2026 results, the season remains very strong in terms of earnings growth, even though the magnitude of positive surprises is somewhat weaker than in recent years. 84% of companies have beaten EPS expectations, compared with a 5-year average of 78% and a 10-year average of 77%. Earnings growth for the index has risen to 31.4% year over year from 30.1% a week earlier and 29.1% expected at the end of September. If this level holds, it would mark the third consecutive quarter of earnings growth above 25% and the eighth consecutive quarter of double-digit growth. On the revenue side, 74% of companies have beaten estimates, while reported revenues are on average 2.1% above expectations. Blended revenue growth for the index has increased to 14.3% year over year from 13.6% a week earlier and 12.2% at the end of September. All 11 sectors are reporting year-over-year growth in both revenues and earnings, led by Information Technology, Energy and Communication Services. Analysts currently expect EPS growth of 28.4% for Q4 and 33.3% for full-year 2026.
Revenues are also beating expectations, while the magnitude of surprises remains solid
The revenue side of the Q3 earnings season also looks constructive. 74% of S&P 500 companies are reporting sales above consensus, while 26% are coming in below expectations. The share of positive revenue surprises is below the 1-year average of 77%, but above the 5-year average of 70% and the 10-year average of 68%. Energy is leading, with 100% of reporting companies beating revenue estimates, followed by Information Technology at 93% and Health Care at 91%. Consumer Discretionary is the weakest sector, with 54% of companies beating consensus. The magnitude of revenue surprises is also notable. Aggregate revenues among reporting companies are currently 2.1% above expectations, exactly in line with the 1-year average and above the 5-year average of 1.8% and the 10-year average of 1.6%. Unlike EPS, where the size of positive surprises has weakened materially relative to historical norms, revenues are still beating expectations at a pace at least in line with recent years. This suggests that S&P 500 earnings growth is being supported not only by margins and cost control, but also by still-solid top-line growth.
Most companies are beating EPS estimates, but the size of the beats is weakening
With 88% of S&P 500 companies having reported Q3 results, as many as 84% have delivered EPS above consensus, 4% have reported in line with expectations and 12% have missed. The share of positive EPS surprises therefore remains above the 1-year average of 82%, the 5-year average of 78% and the 10-year average of 77%. Energy leads with 95% of companies beating EPS estimates, followed by Information Technology at 94% and Health Care at 93%. Materials is the weakest sector, with 57% of companies beating expectations. Health Care has delivered the largest positive aggregate earnings surprise at +13.7%, while Utilities and Energy are both at +8.2% and Industrials at +7.3%. At the other end of the spectrum, Communication Services stands at -24.6%, weighed down in part by weaker results from Charter Communications, Meta Platforms and Alphabet.
Big Tech loses momentum versus the rest of the index, while CAPEX continues to rise
Analysts raised their Q4 2026 EPS estimate for the S&P 500 by 1.4%. This is the fifth quarter out of the past six in which estimates have increased during the first month of the quarter. Over the past 20 years, estimates have declined by an average of 1.9% during the same period.
- Energy recorded the largest upward revision to EPS estimates at +20.3%, while Consumer Staples posted the largest decline at -4%.
- Information Technology received the second-largest upward EPS revision after Energy, at +1.3%.
- The EPS estimate for the full S&P 500 for 2026 increased by 0.6% in October.
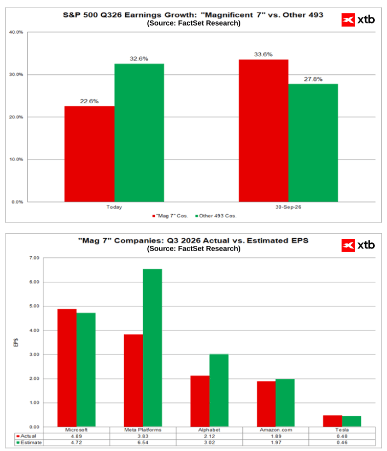
Magnificent Seven earnings are growing by 22.6% year over year in Q3 2026, compared with 32.6% for the other 493 companies in the S&P 500. As recently as September 30, expectations stood at 33.6% and 27.8%, respectively. The S&P 500 has declined recently even as earnings expectations for U.S. companies have continued to improve. The five largest hyperscalers increased quarterly CAPEX, confirming that the race to build AI infrastructure continues to accelerate despite rising costs. Oracle and Amazon posted the strongest increases following their latest results, while Alphabet, Meta and Microsoft maintained a more moderate, though still double-digit, pace of growth. Spending expectations remain high: Microsoft trimmed its full-year outlook slightly, while Meta raised its forecast.
Source: XTB Research, FactSet
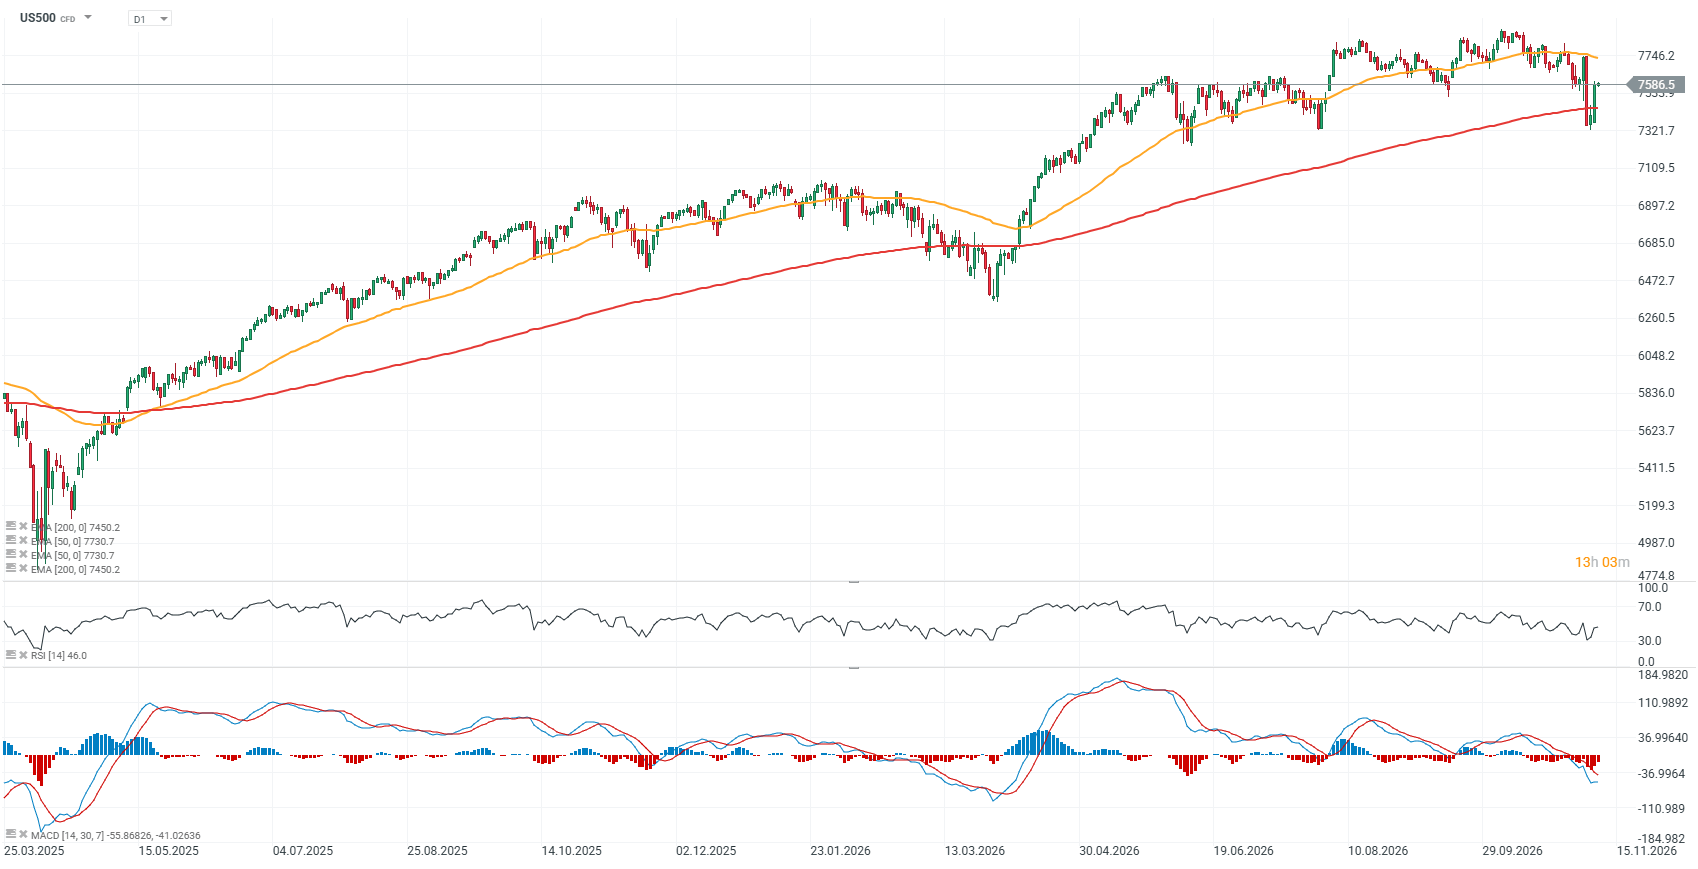
US500 chart (D1 interval)
US500 futures have staged a V-shaped rebound, a pattern often seen after intense sell-offs. More than half of last Thursday’s decline has already been erased, while the index has defended the 200-day EMA, shown by the red line. This average now acts as an important support level around 7,450 points, while previous price reactions near 7,300 points represent another important support zone from a price-action perspective. For the index, the key now is to remain above the EMA200 and recover above 7,750 points, which is the main resistance area. Lower inflation readings and weaker oil prices could support further upside, while uncertainty around the AI sector may intensify if crude prices move back above $100 per barrel and Treasury yields remain elevated amid a more inflationary macro environment.
Source: xStation5