S&P 500 — US Large Cap Index
 FTSE 100 — UK Blue Chips
 Euro Stoxx 50 — Eurozone Leaders
 DAX 40 — German Equities
 CAC 40 — French Market Index
 Nikkei 225 — Japan Benchmark
 Hang Seng — Hong Kong Index
 Shanghai Composite — China Mainland
 ASX 200 — Australian Market
 TSX Composite — Canada Index
 Nifty 50 — India Large Cap
 STI Index — Singapore Market
 KOSPI — South Korea Index
 Bovespa — Brazil Equities
 JSE Top 40 — South Africa Index
 IPC Index — Mexico Market
- UK Retail Sales surprise to the upside but fail to lift Sterling.
- US Consumer Sentiment drops sharply; inflation expectations surge to multi-year highs.
- Markets digest mixed trade signals as China mulls tariff exemptions on US goods.
The Pound Sterling registers losses against the strong US Dollar, yet it remains above 1.3300. A strong UK Retail Sales report failed to underpin Cable, which registers losses of 0.20% as the GBP/USD trades at 1.3311.
GBP/USD holds above 1.3300 amid weak US sentiment, hot inflation expectations, and ongoing tariff drama
The financial markets’ narrative hasn’t changed, with traders focused on US President Donald Trump’s trade policies and China’s response to tariffs. Although economic data has taken a backseat, deterioration in US Consumer Sentiment and a solid UK Retail Sales report prevented the GBP/USD from falling below 1.33.
Bloomberg reported that China may exempt some US goods from tariffs as costs rise. The news was cheered by the markets, with risk sentiment improving, but it was short-lived.
Data from the University of Michigan (UoM) revealed that Consumer Sentiment in April fell to its lowest level, from 57 to 52.2, the fourth lowest reading in the data series dating back to the late 1970s. The same poll revealed that inflation expectations for one year rose from 5% to 6.5% and for a five-year increase to 4.4% from 4.1%.
Earlier, retail sales in the UK rose unexpectedly, revealing the ONS. March’s sales increased 0.4% MoM, down from 0.7%, exceeding forecasts of a -0.4 % contraction. Meanwhile, traders are the words of Bank of England’s (BoE) Megan Greene, who said, “We are not sure if weakness in the UK economy is caused by demand or supply.”
She added that the labor market has weakened pretty slowly and that the central bank is seeing an output gap open up, which could help bring inflation lower.
GBP/USD Price Forecast: Technical outlook
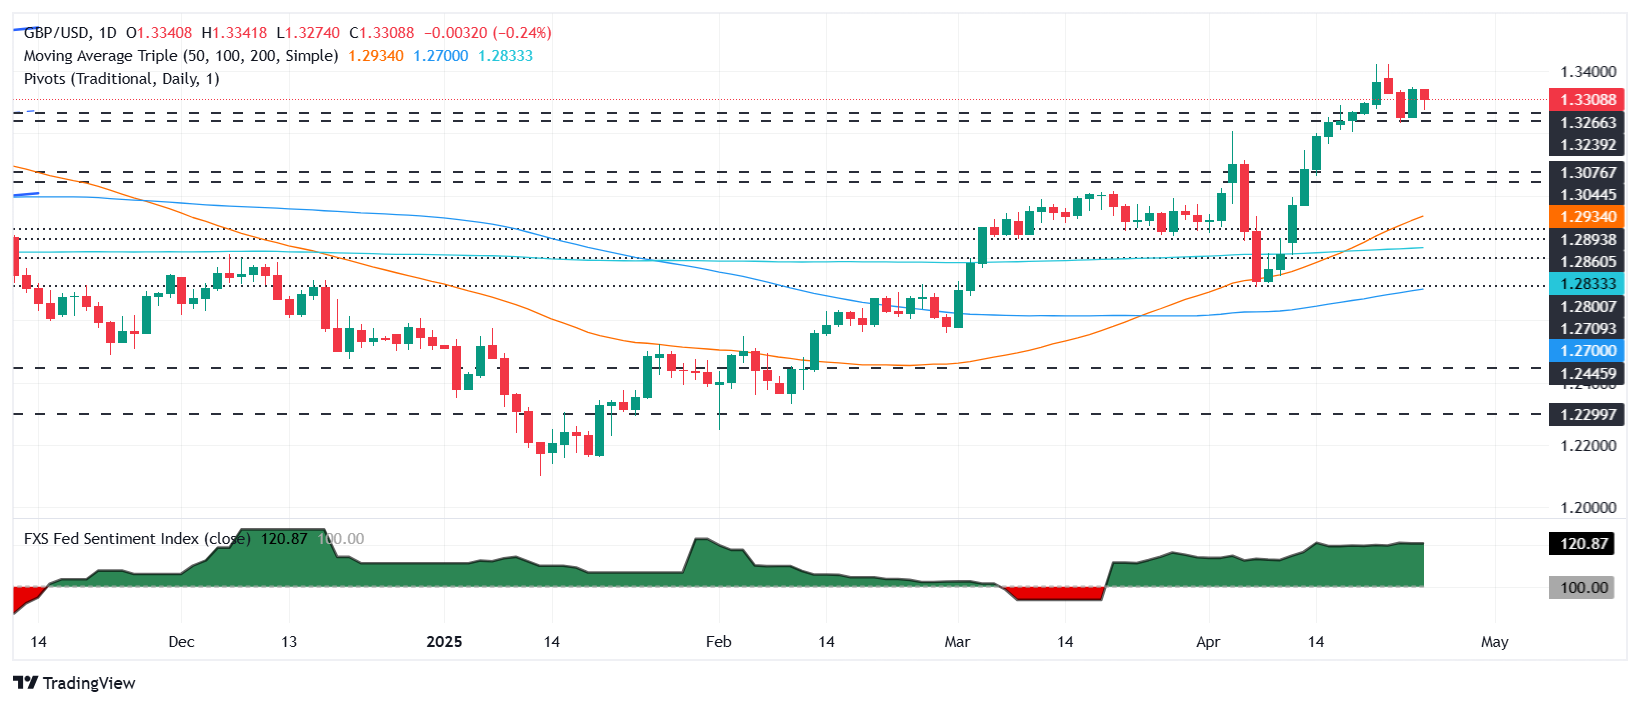
The GBP/USD remains upward biased but seems poised to crack key support at 1.3300 in the short term. The Relative Strength Index (RSI) shows that sellers gather steam even though the RSI is still bullish. However, buyers’ failure to decisively crack 1.3400 exacerbated GBP/USD’s dip toward key support levels.
The pair’s next support would be the 50-day Simple Moving Average (SMA) at 1.3238, followed by 1.3200. Conversely, if buyers push GBP/USD past 1.3350, expect a retest of 1.34.
British Pound PRICE This week
The table below shows the percentage change of British Pound (GBP) against listed major currencies this week. British Pound was the strongest against the Swiss Franc.
| USD | EUR | GBP | JPY | CAD | AUD | NZD | CHF | |
|---|---|---|---|---|---|---|---|---|
| USD | 0.26% | -0.10% | 1.28% | 0.03% | -0.16% | -0.57% | 1.60% | |
| EUR | -0.26% | -0.52% | 0.97% | -0.28% | -0.62% | -0.87% | 1.31% | |
| GBP | 0.10% | 0.52% | 1.67% | 0.26% | -0.10% | -0.35% | 1.84% | |
| JPY | -1.28% | -0.97% | -1.67% | -1.19% | -1.54% | -1.70% | 0.36% | |
| CAD | -0.03% | 0.28% | -0.26% | 1.19% | -0.32% | -0.61% | 1.59% | |
| AUD | 0.16% | 0.62% | 0.10% | 1.54% | 0.32% | -0.24% | 1.94% | |
| NZD | 0.57% | 0.87% | 0.35% | 1.70% | 0.61% | 0.24% | 2.22% | |
| CHF | -1.60% | -1.31% | -1.84% | -0.36% | -1.59% | -1.94% | -2.22% |
The heat map shows percentage changes of major currencies against each other. The base currency is picked from the left column, while the quote currency is picked from the top row. For example, if you pick the British Pound from the left column and move along the horizontal line to the US Dollar, the percentage change displayed in the box will represent GBP (base)/USD (quote).