S&P 500 — US Large Cap Index
 FTSE 100 — UK Blue Chips
 Euro Stoxx 50 — Eurozone Leaders
 DAX 40 — German Equities
 CAC 40 — French Market Index
 Nikkei 225 — Japan Benchmark
 Hang Seng — Hong Kong Index
 Shanghai Composite — China Mainland
 ASX 200 — Australian Market
 TSX Composite — Canada Index
 Nifty 50 — India Large Cap
 STI Index — Singapore Market
 KOSPI — South Korea Index
 Bovespa — Brazil Equities
 JSE Top 40 — South Africa Index
 IPC Index — Mexico Market
- Gold price rallies over 0.7% and ekes out a fresh all-time high at $3,086.
- Markets are heading into safe-haven Gold while Equities and Cryptocurrencies drop.
- Gold traders are now targeting $3,100 in the near term.
Gold price (XAU/USD) is printing another record performance this Friday, hitting $3,086 as the new all-time high for now and trading around $3,077 at the time of writing. Bullion sees another wave of safe-haven inflow, this time from investors that are exiting Equity and Crypto positions. From here, the next big psychological target and level to beat will be $3,100.
Later this Friday, the US Personal Consumption Expenditures (PCE) data for February is due. The overall consensus is for rather steady numbers, with the monthly core PCE expected to remain unchanged at 0.3%, while the headline figure should remain cemented at 0.3% as well.
These past few days, inflation concerns in the United States (US) have been picking up as the impact of the United States (US) President Donald Trump’s tariff implementations on inflation is hard to measure. The risks of the US economy heading into recession or stagflation are major concerns for investors and could bring moves in Equity and Bond markets, and see Gold extending further.
Daily digest market movers: PCE reading and rates
- Inflation in France and Spain undershot expectations this Friday, supporting calls for more interest rate cuts by the European Central Bank (ECB). The French headline Consumer Price Index year-on-year grew steadily by 0.9% this month, defying analyst predictions for an uptick. In Spain, it slowed by 2.2%, a much deeper deceleration than expected, and is the first country that approaches the ECB’s target of 2%, Bloomberg reports.
- Some fair-value modeling reveals that Gold is 13% overvalued, suggesting that further policy uncertainty regarding US tariff execution is already factored in. A peace deal for Ukraine could see the precious metal give up some gains as geopolitical risk perceptions ease, Reuters reports.
- On Thursday, US President Donald Trump signed a proclamation to implement a 25% tariff on auto imports and pledged harsher punishment on the EU and Canada if they join forces “to do economic harm” against the US, while April 2nd approaches fast for the so-called reciprocal tariff implementation, Bloomberg reports.
Gold Price Technical Analysis: Solid for now
Traders are starting to throw in the towel on Equities and Crypto, with Gold being the hottest place in town. More and more analysts are revising their calls for Gold to higher levels, which means that a crucial point of being ‘overbought’ is starting to grow. Taking part in the rally still makes sense, but at least paying attention to specific levels will make the trade more manageable on where to get in, where to take profit, or when to stop it out.
On the upside, the daily R1 resistance for XAU/USD comes in at $3,072 and has already been tested earlier this Friday. Further up, the R2 resistance at $3,086 coincides with the fresh all-time high. Once from there the $3,100 mark looks far off, but still, it could see the rally at least move in that direction.
On the downside, the first support to be considered is the daily Pivot Point at $3,044, followed by the intraday S1 support at $3,030. Further down, the S2 support comes in at $3,002, which roughly coincides with the $3,000 mark psychological level.
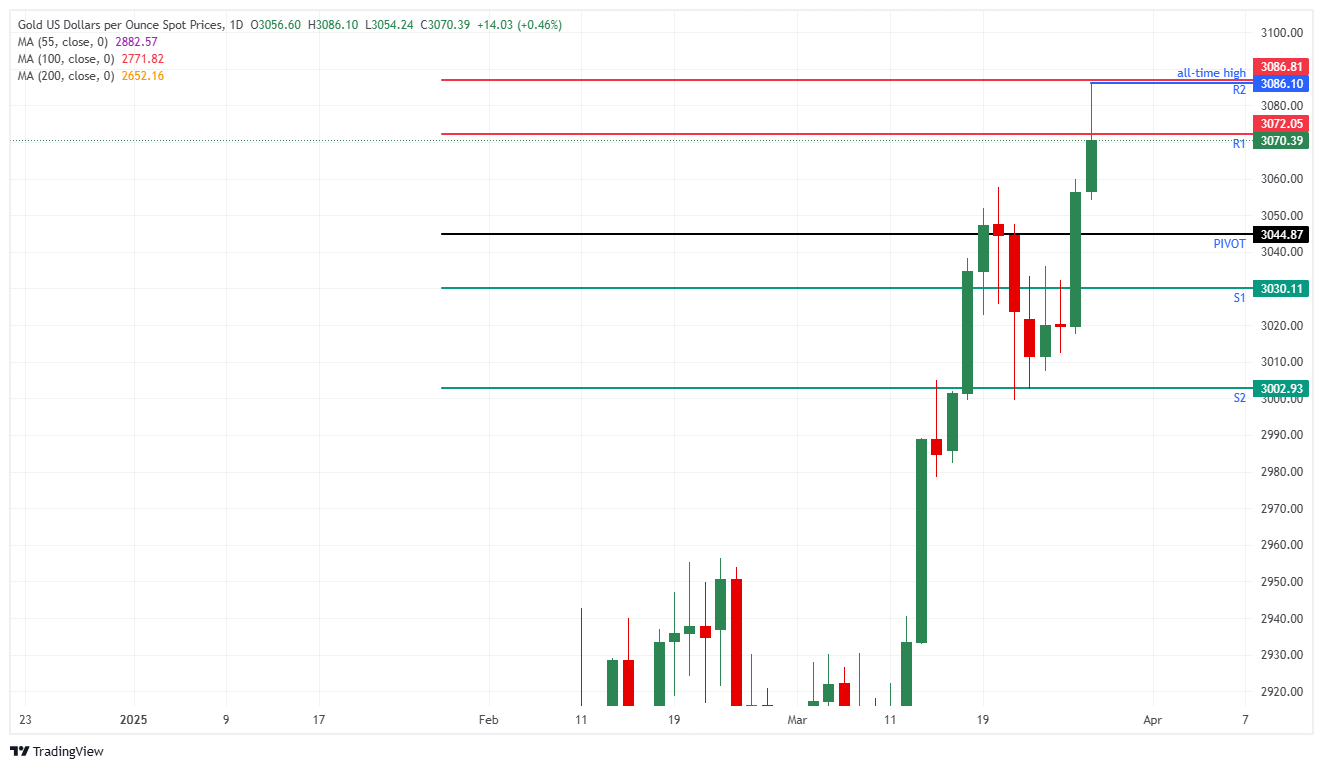
XAU/USD: Daily Chart