S&P 500 — US Large Cap Index
 FTSE 100 — UK Blue Chips
 Euro Stoxx 50 — Eurozone Leaders
 DAX 40 — German Equities
 CAC 40 — French Market Index
 Nikkei 225 — Japan Benchmark
 Hang Seng — Hong Kong Index
 Shanghai Composite — China Mainland
 ASX 200 — Australian Market
 TSX Composite — Canada Index
 Nifty 50 — India Large Cap
 STI Index — Singapore Market
 KOSPI — South Korea Index
 Bovespa — Brazil Equities
 JSE Top 40 — South Africa Index
 IPC Index — Mexico Market
- Trump allows talks, but declares the US-Iran ceasefire officially over.
- Fed minutes show inflation worries and rate-hike debate.
- CPI and Warsh testimony drive the next Gold catalyst.
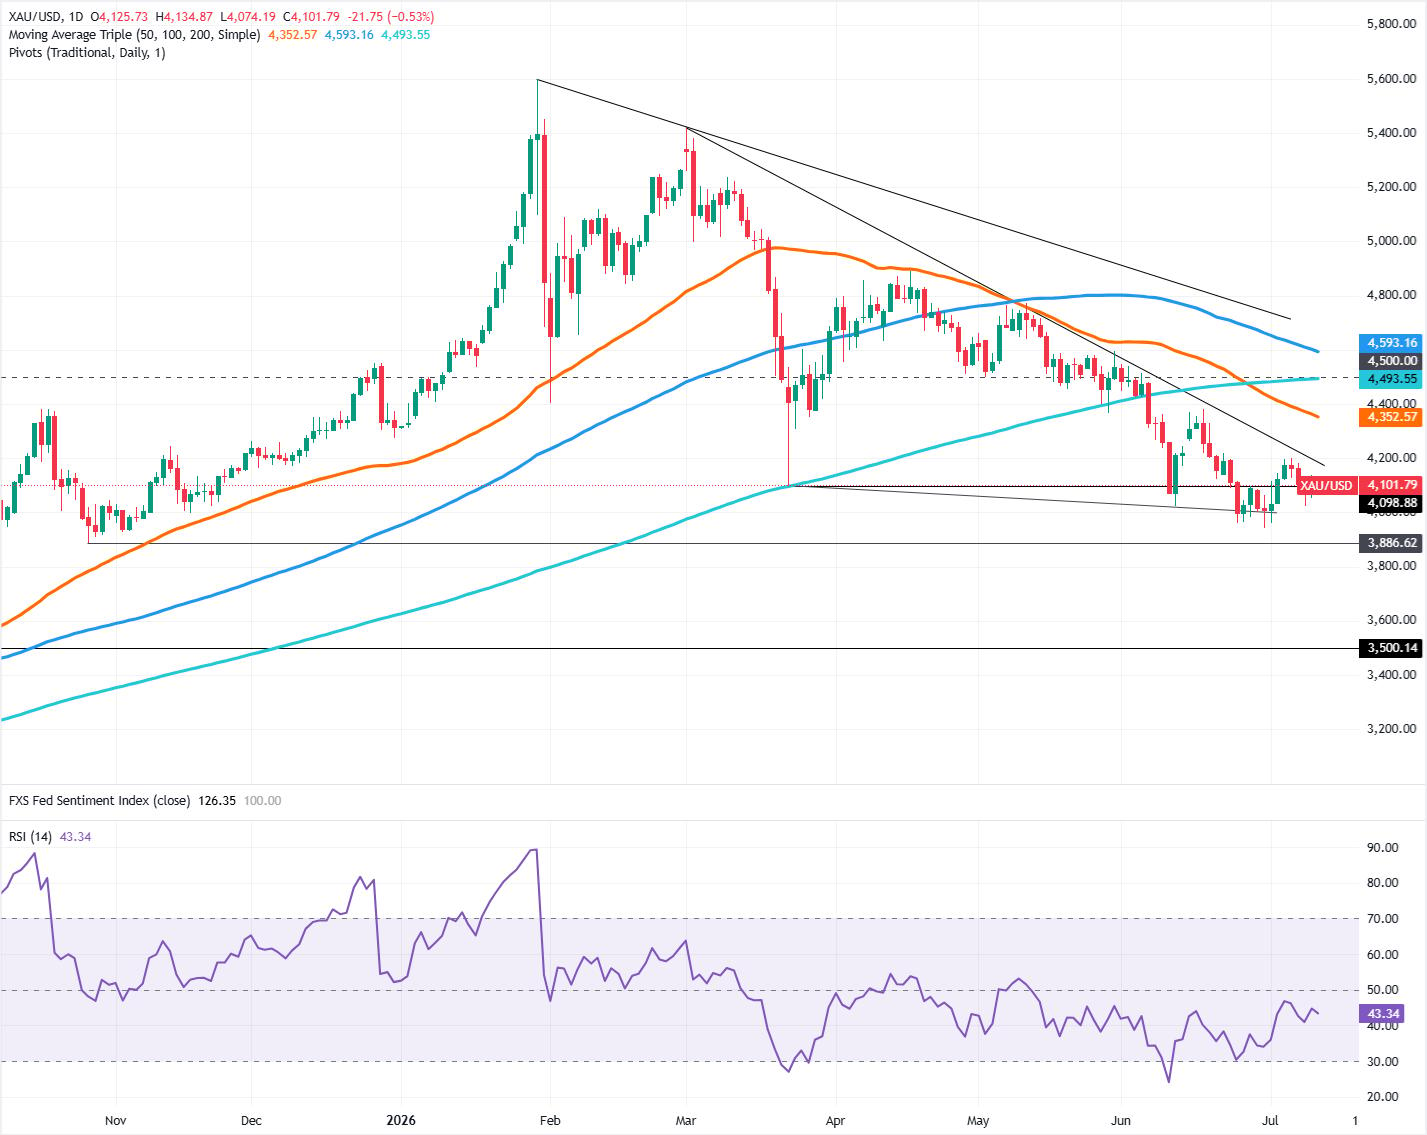
Gold (XAU/USD) price retreats on Friday during the North American session, pressured by US President Donald Trump’s comments allowing the resumption of US-Iran talks, but reiterating that the ceasefire is “over.” The XAU/USD pair trades at around $4,103, down 0.48%.
XAU/USD falls as renewed war risks lift yields and Dollar
The yellow metal seems poised to end the week down 0.51%, driven by the escalation of the conflict. The Greenback erased its earlier losses, as the US Dollar Index (DXY), which measures the buck’s value against six currencies, holds firm at 100.94, unchanged.
In his Truth Social account, President Trump posted, “The Islamic Republic of Iran has asked us to continue ‘talks.’ We have agreed to do so, but the United States has stated to them, in no uncertain terms, that the Cease Fire is OVER! Thank you for your attention to this matter. President DONALD J. TRUMP.”
After the post, US Treasury yields surged, with the 10-year T-note up 2 basis points to 4.569%, amid fears that energy prices could rise, fueling fears of higher interest rates if hostilities continued.
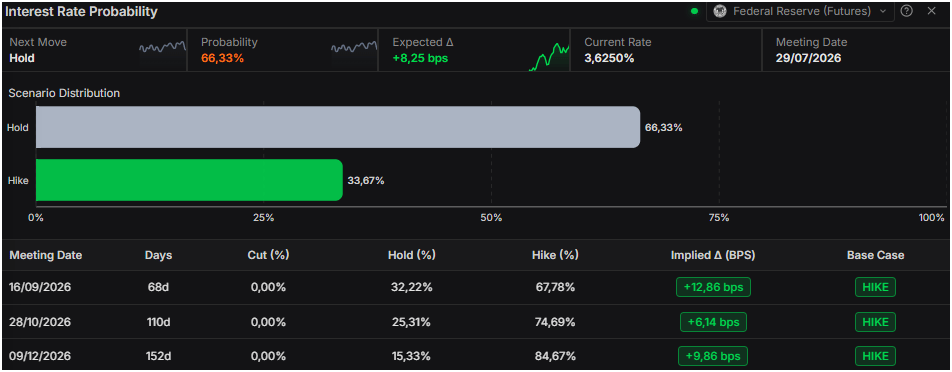
Money markets have priced in an 80% chance of a Federal Reserve (Fed) rate increase at the September meeting. Odds for the July 29 meeting suggest that the central bank will hold rates, with the chances for a hike being shy of 34%, according to Prime Terminal data.
The US economic docket was light this week, with the release of the FOMC’s last meeting minutes, which were closely scrutinised for the absence of forward guidance. The minutes showed that officials are concerned about inflation, with a “few participants” seeing the case for a rate hike.
On Thursday, Initial Jobless Claims fell to 215K, below estimates of 218K and the previous reading of 217K, an indication that the labor market is stable.
Now eyes turn to next week’s economic docket, with investors eyeing the release of US inflation data and Federal Reserve Chair Kevin Warsh’s testimony before the US Congress.
XAU/USD technical outlook: Gold remains bearish below the 200-day SMA
Gold’s downtrend remains in play, as the market structure of a successive series of lower highs and lower lows is intact. Alongside this, momentum, as measured by the Relative Strength Index (RSI), is declining and is now in bearish territory, and XAU’s spot price is below the 200-day Simple Moving Average (SMA) at $4,493.
With all three of those reasons in play, Bullion prices might continue to edge lower, so any leg-up could be an opportunity for sellers.
XAU/USD first support would be the July 8 swing low of $4,021. Beneath lies the June 30 swing low of $3,941, followed by the October 28, 2025, swing low of $3,886.
Going upwards, if Gold surpasses a downslope resistance trendline near $4,200, it opens the door for challenging the $4,300 milestone. Above this area, the next ceiling level is the 200-day Simple Moving Average (SMA) at $4,493.