S&P 500 — US Large Cap Index
 FTSE 100 — UK Blue Chips
 Euro Stoxx 50 — Eurozone Leaders
 DAX 40 — German Equities
 CAC 40 — French Market Index
 Nikkei 225 — Japan Benchmark
 Hang Seng — Hong Kong Index
 Shanghai Composite — China Mainland
 ASX 200 — Australian Market
 TSX Composite — Canada Index
 Nifty 50 — India Large Cap
 STI Index — Singapore Market
 KOSPI — South Korea Index
 Bovespa — Brazil Equities
 JSE Top 40 — South Africa Index
 IPC Index — Mexico Market
Indian Rupee ticks higher as oil prices decline while Iran uncertainty persists


- The Indian Rupee ticks higher against the US Dollar as oil prices decline.
- Iran alleges that the US is violating the ceasefire.
- FIIs turned out to be net sellers on Tuesday, offloading the stake worth Rs. 2,407.87 crore.
The Indian Rupee (INR) trades marginally higher against the US Dollar (USD) in the opening session on Wednesday. The USD/INR pair ticks lower to near 95.70 as oil prices fail to hold their Tuesday’s recovery move, with market participants remaining confident that the United States (US) and Iran are close to reaching a deal.
At press time, the WTI Oil price trades 1.8% lower to near $90.80. Currencies from economies, such as India, which rely heavily on oil imports to meet their energy needs, attract bids following a sharp correction in oil prices.
US-Iran negotiations continue despite US defensive attacks on Iran
On Tuesday, Iran’s Islamic Revolutionary Guard Corps (IRGC) threatened retaliation after the US carried out strikes on southern Iran, which were described as “self-defense” by the US Central Command. The Iranian Foreign Ministry condemned the US attacks, calling them a “gross violation” of the ceasefire.
However, negotiations between the US and Iran regarding an end to the Middle East war and the reopening of the Strait of Hormuz, a vital passage to almost 20% of global energy supply, continue through mediators.
An Iranian official said on Tuesday that the unfreezing of Iran’s funds is the last serious sticking point with the United States (US) being resolved through Qatar mediation, Fars agency reported. However, there had been no official confirmation.
Earlier this week, US Secretary of State Marco Rubio said that the Strait of Hormuz has to be open “one way or the other,” and finalizing the deal with Iran may take a few days.
FIIs remained net sellers on Tuesday
There seems to be a mixed sentiment of Foreign Institutional Investors (FIIs) toward the Indian stock market the entire month. Overseas investors have been seen turning out net sellers on alternative days, with no clear pattern. On Tuesday, FIIs offloaded their stake worth Rs. 2,407.87 crore after increasing by Rs. 821.75 crore on Monday.
US Dollar wobbles ahead of US PCE Inflation data
The US Dollar trades in a tight range around 99.00 as investors await clear signals from the US and Iran regarding the progress in negotiations toward a permanent deal.
On the domestic front, investors await the US Personal Consumption Expenditure Price Index (PCE) data for April, which will be released on Thursday. Investors will pay close attention to the US PCE inflation data to get fresh cues on the Federal Reserve’s (Fed) monetary policy outlook.
The US core PCE inflation – which is the Fed’s preferred inflation gauge – is estimated to have grown at an annualized pace of 3.3%, faster than 3.2% in March, with monthly figures growing steadily by 0.3%.
Technical Analysis: USD/INR attracts bids near 20-day EMA
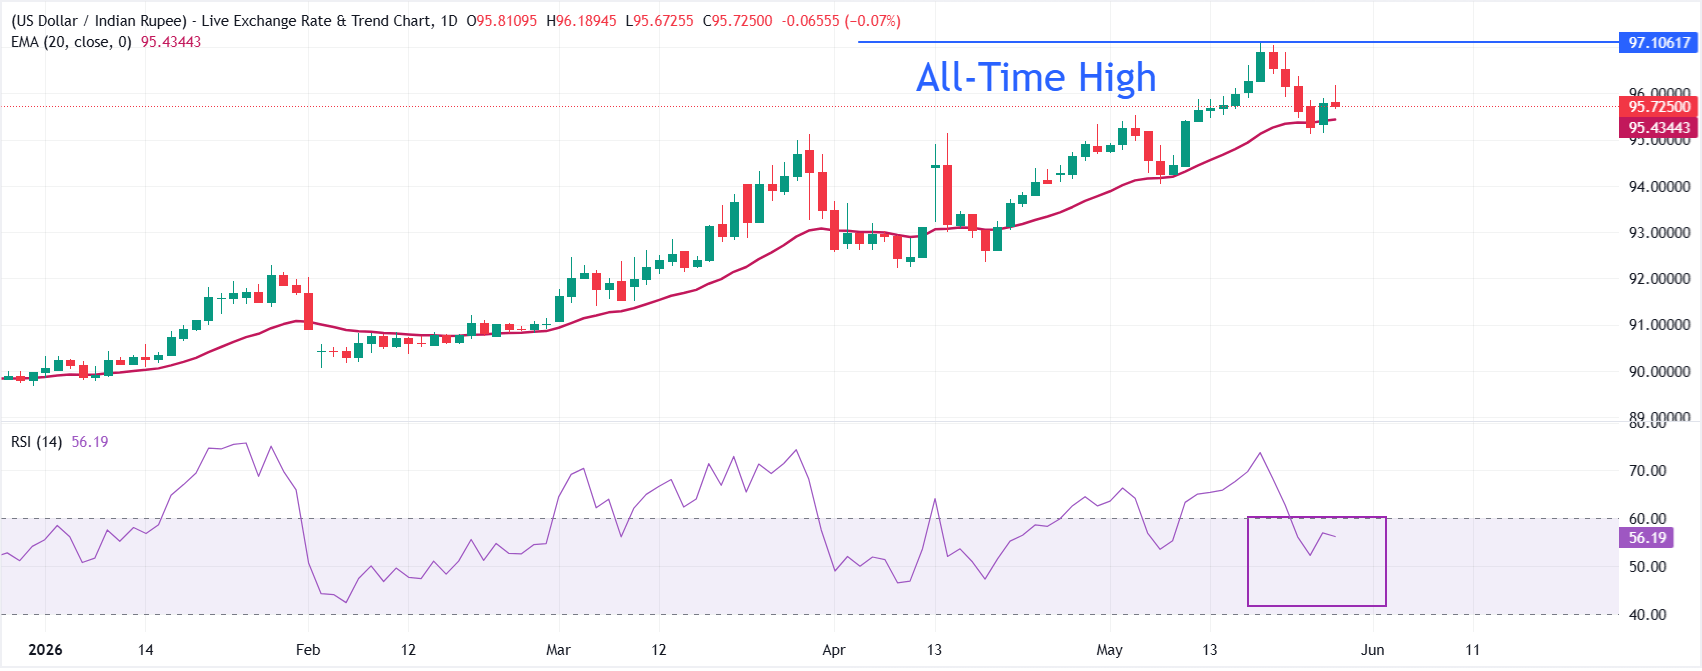
USD/INR trades slightly lower at around 95.70 as of writing. The pair holds a constructive bullish bias as spot remains above the 20-period Exponential Moving Average (EMA) at 95.4387.
The EMA’s upward slope hints that the recent advance is still supported, while the Relative Strength Index (RSI) near 56 suggests positive but not overbought momentum, allowing room for further gains if buyers stay in control.
On the downside, initial support is located at the 20-day EMA around 95.44, where a break would signal fading short-term momentum and expose a deeper corrective move towards 95.00. Looking up, the pair would attempt to return to the all-time high around 97.00 if it manages to recover above the May 22 high at 96.37.