S&P 500 — US Large Cap Index
 FTSE 100 — UK Blue Chips
 Euro Stoxx 50 — Eurozone Leaders
 DAX 40 — German Equities
 CAC 40 — French Market Index
 Nikkei 225 — Japan Benchmark
 Hang Seng — Hong Kong Index
 Shanghai Composite — China Mainland
 ASX 200 — Australian Market
 TSX Composite — Canada Index
 Nifty 50 — India Large Cap
 STI Index — Singapore Market
 KOSPI — South Korea Index
 Bovespa — Brazil Equities
 JSE Top 40 — South Africa Index
 IPC Index — Mexico Market

- The Indian Rupee reflects broader strength amid strong FCNR receipts and receded hawkish Fed bets.
- Fed’s Waller says that recent data shows some signs of disinflation.
- Soft US ADP data for August sets a weak bar for the US NFP.
The Indian Rupee (INR) opens on a flat note against the US Dollar (USD) on Friday, but is close to its two-month high of 94.29 posted the previous day. The Indian currency strengthens due to strong inflows of foreign funds through the Reserve Bank of India’s Foreign Currency Non-Resident (FCNR) (B) scheme and diminished Federal Reserve (Fed) interest rate hike expectations.
RBI reports strong foreign inflows through FCNR scheme
Strategists at Societe Generale highlight that the RBI has materially strengthened its firepower, noting that “the RBI yesterday disclosed that it had raised $136.38 billion through its FX mobilisation schemes, including the FCNR(B) window launched in early June, significantly bolstering reserve buffers and intervention capacity.”
Fed Waller says recent data indicates signs of slowing inflationary pressures
On Thursday, Fed Governor Christopher Waller said at the Reuters NEXT Newsmaker event, “Finally seeing some signs of disinflation in recent data.” Waller pushing back upside inflation risks resulted in a sharp decline in the US Dollar, with traders paring hawkish Fed bets.
The CME FedWatch tool shows traders see a one-in-two chance that the Fed will hike interest rates at the September meeting, down from a two-in-a-three chance seen before Fed Waller’s speech.
Regarding the Fed’s monetary policy outlook, Governor Waller said that he would “support holding interest rates steady” at the September meeting if the Consumer Price Index (CPI) growth cools down. Waller also kept the option of a rate hike on the table in case the inflation data remains hot. “If August inflation data shows progress has reversed, small adjustment to policy rate would help ensure progress resumes,” Waller said.
US NFP data awaited
The next major driver for the US Dollar’s outlook is expected to be the US Nonfarm Payrolls (NFP) data for August, which will be published at 12:30 GMT.
Brown Brothers Harriman’s Elias Haddad points out that the latest US labor market read from ADP did little to dispel concerns about cooling demand. He notes that “the ADP August private payrolls data showed labor demand remains unimpressive,” with the economy adding “+38k private sector jobs in August (consensus: +47k) vs. +46k in July, the lowest reading since January.” Haddad cautions, however, that “the correlation between monthly change in ADP private payrolls and nonfarm payrolls (NFP) is weak,” limiting the extent to which investors can extrapolate the ADP miss into Friday’s official employment report.
According to estimates, the US economy created 56K fresh jobs after laying off 23K employees in July. The Unemployment Rate is seen as steady at 4.1%.
USD/INR Technical Analysis
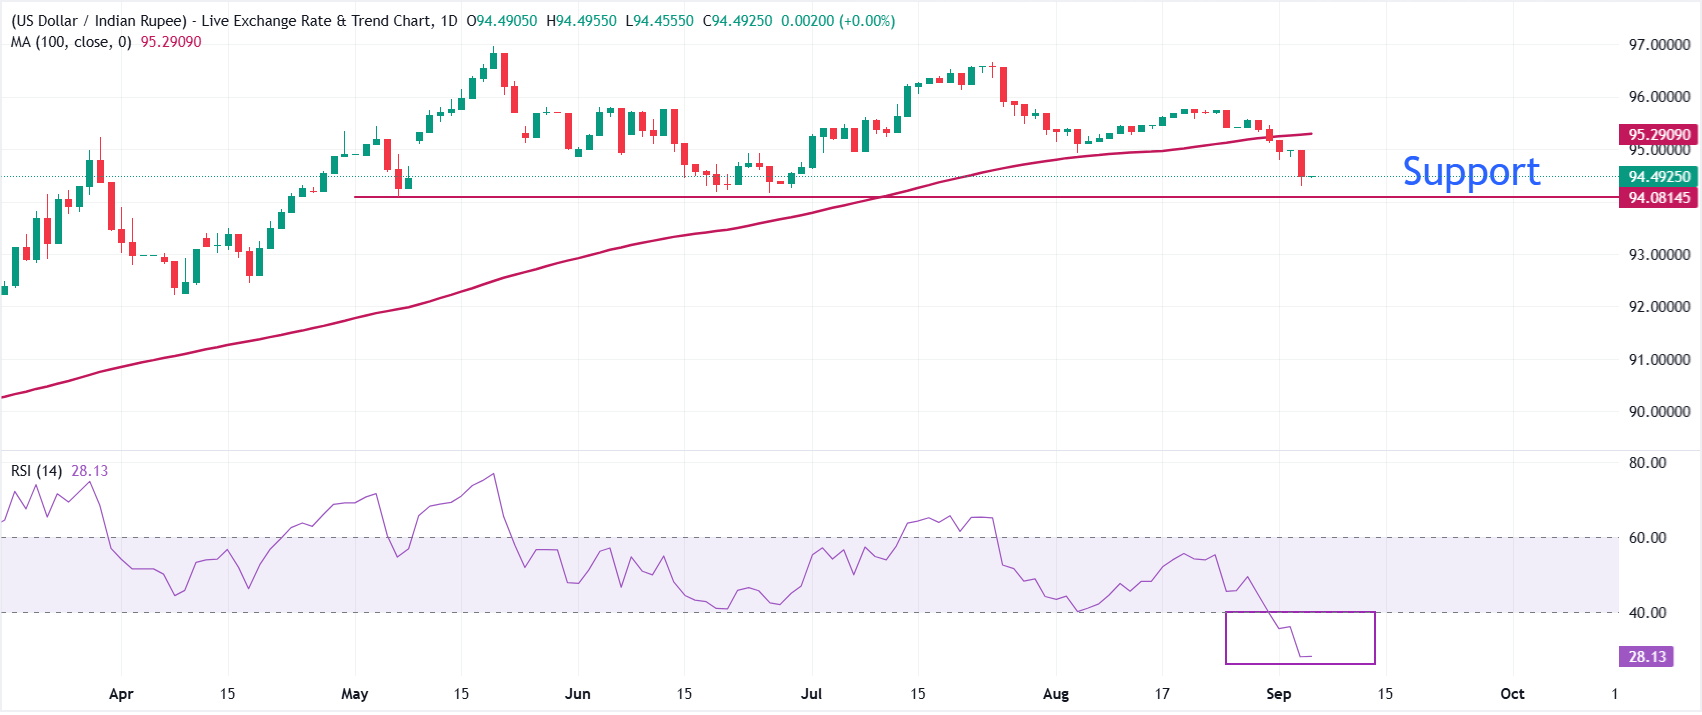
In the daily chart, USD/INR trades at 94.4925, extending a downside bias as price holds below the 100-day simple moving average (SMA) at 95.2909. The break under this medium-term gauge suggests sellers remain in control, while the Relative Strength Index (RSI) near 28 signals oversold conditions that could slow, but not yet reverse, the prevailing downtrend.
On the downside, the immediate focus remains on how price behaves around the current 94.49 area, as a sustained close beneath it would expose further weakness toward the May low at 94.08. On the topside, a recovery back above the 100-day SMA at 95.29 would be needed to ease bearish pressure and hint at a corrective rebound toward higher levels.