S&P 500 — US Large Cap Index
 FTSE 100 — UK Blue Chips
 Euro Stoxx 50 — Eurozone Leaders
 DAX 40 — German Equities
 CAC 40 — French Market Index
 Nikkei 225 — Japan Benchmark
 Hang Seng — Hong Kong Index
 Shanghai Composite — China Mainland
 ASX 200 — Australian Market
 TSX Composite — Canada Index
 Nifty 50 — India Large Cap
 STI Index — Singapore Market
 KOSPI — South Korea Index
 Bovespa — Brazil Equities
 JSE Top 40 — South Africa Index
 IPC Index — Mexico Market

Following Tuesday’s sell-off driven by the semiconductor sector, the future of the bull market led by AI-related companies has been called into question. The publication of Micron’s quarterly data, scheduled for Wednesday evening, therefore assumed particular significance. The tech giant’s report has surpassed already demanding expectations.
- Adjusted earnings per share (EPS) reached $25.11. This result is not only better than expectations ($20.20), but more than double what the company recorded just 3 months earlier.
- Revenue growth proved almost as impressive. It amounted to $23.9bn in Q2, and $41.5bn in Q3.
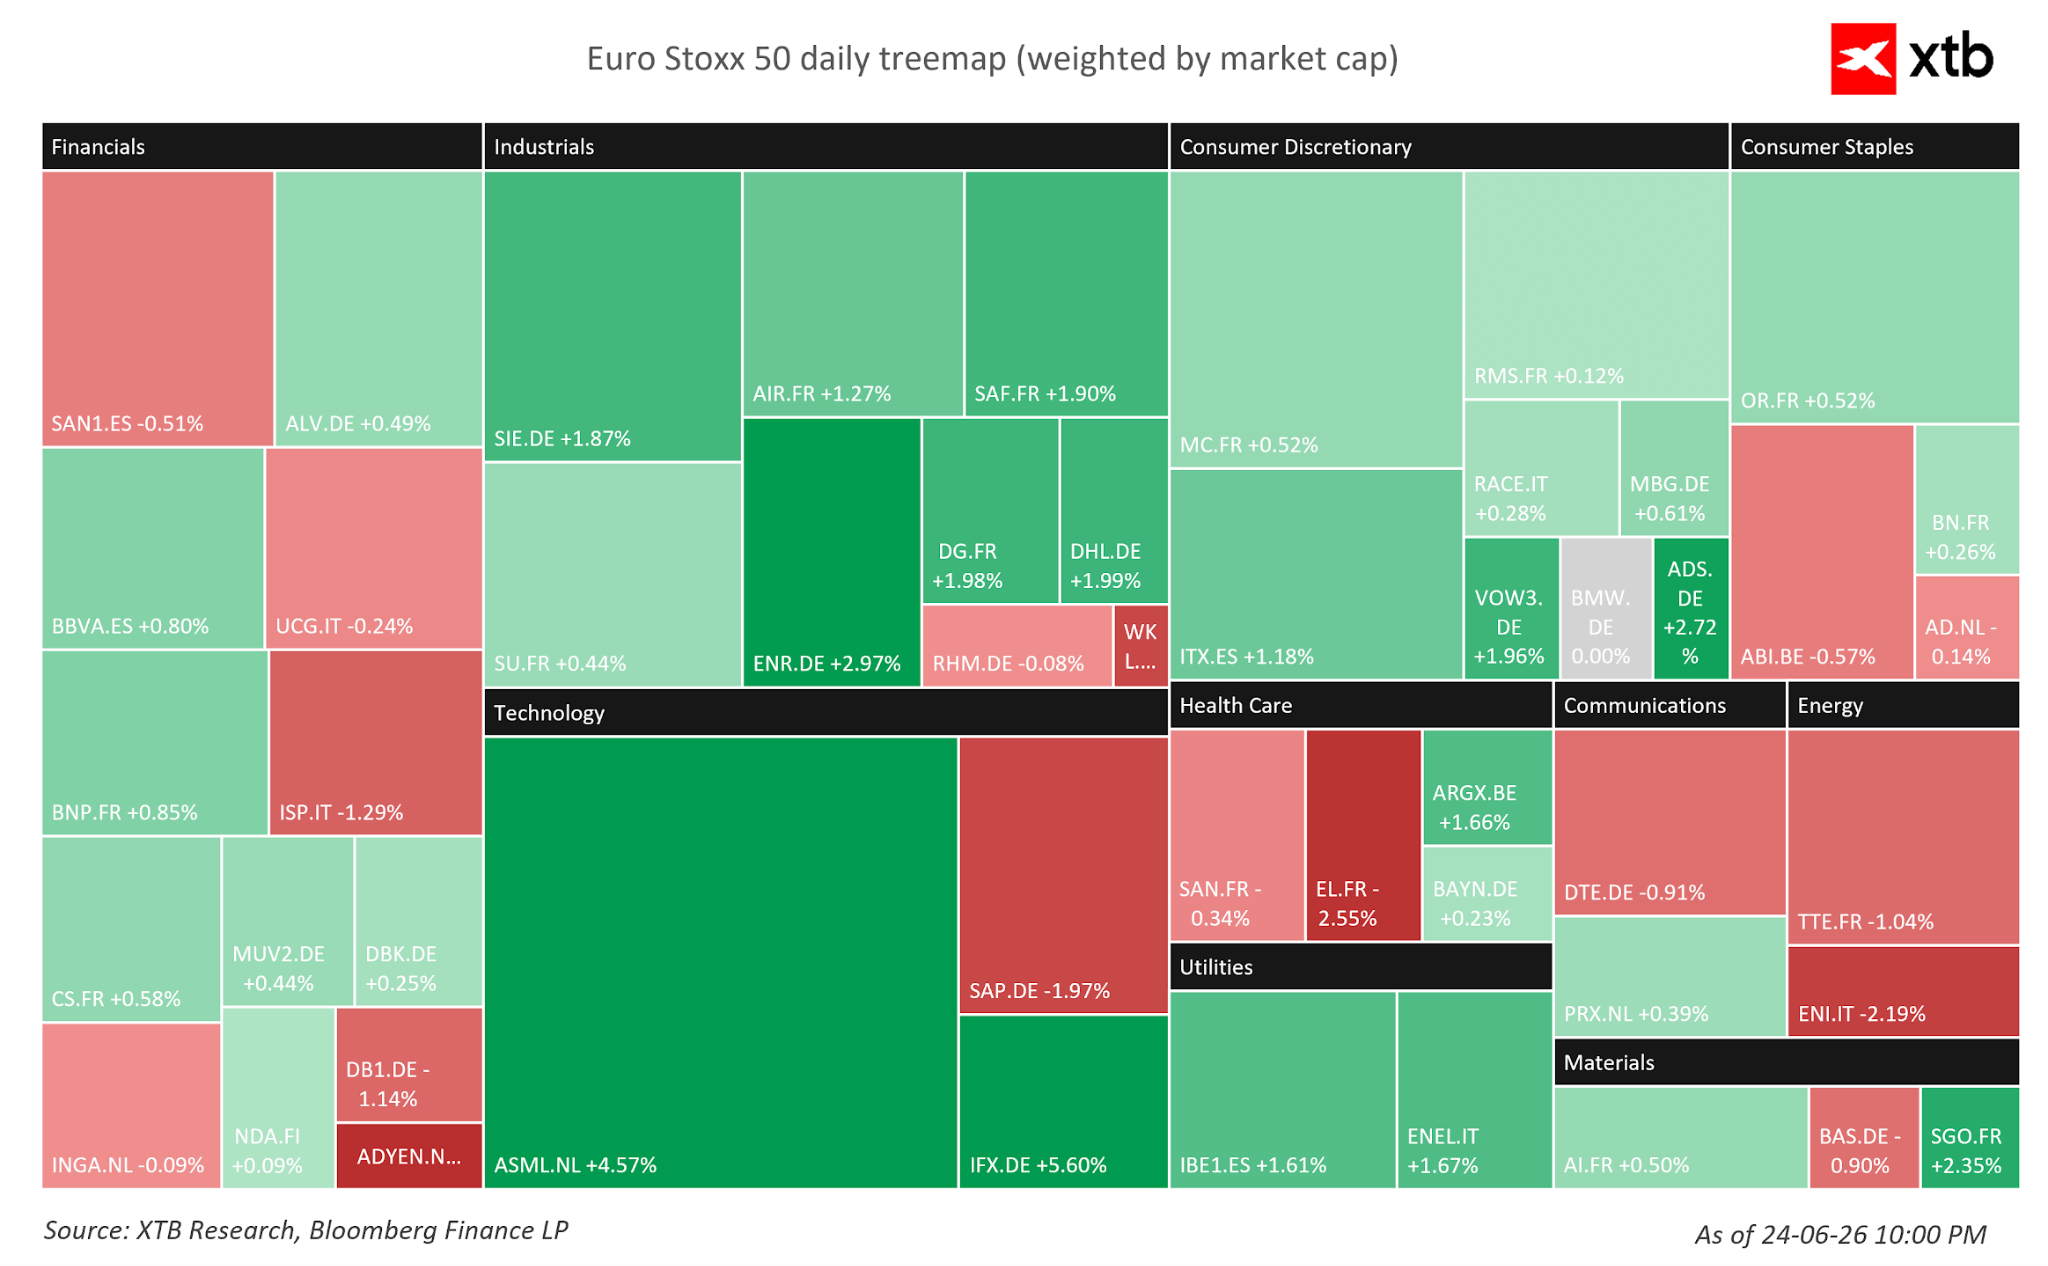
This data is significant not only for the company’s shares (which rose by nearly 19% in pre-market trading), but also for the broader market, as it continues to support the narrative of the profitability of massive investments in the AI sector. Figure 1: Heatmap for Euro Stoxx 50 (25.06.2026)
Source: XTB Research, 25.06.2026
Companies
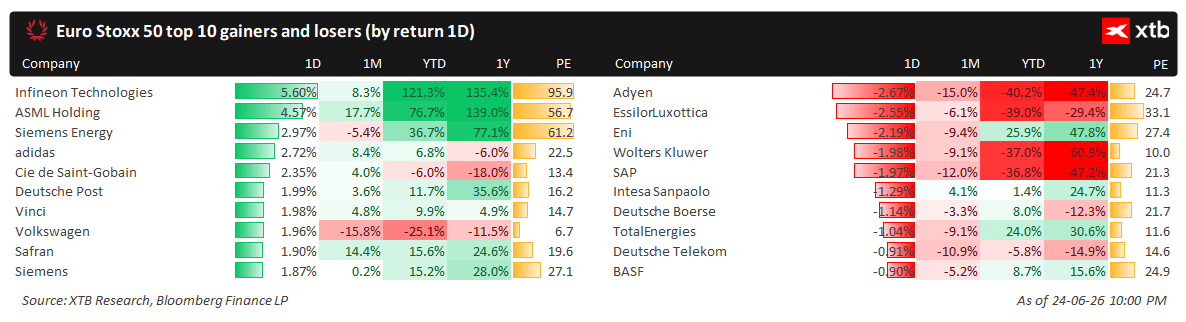
It is therefore unsurprising that among all companies in the Euro Stoxx 50, Infineon Technologies (+5.6%) and ASML Holding (+4.6%) are posting the strongest gains; these companies are engaged in the production of advanced semiconductors and photolithography machines, respectively. Figure 2: Winners and Losers in Euro Stoxx 50 (25.06.2026)
Source: XTB Research, 25.06.2026
Both companies are foundations of the European technology sector, playing distinct yet complementary roles within it:
- ASML Holding supplies the machines that allow chip manufacturers to apply unimaginably fine patterns to silicon wafers. It is a monopolist in the field of EUV lithography systems, without which the production of modern processors for smartphones or AI systems would be impossible.
- Infineon Technologies focuses on the design and production of semiconductors themselves. It is a leader in the segment of power electronics, microcontrollers, and sensors, which are responsible for the “intelligence” of modern electric vehicles and industrial automation systems.
Indices
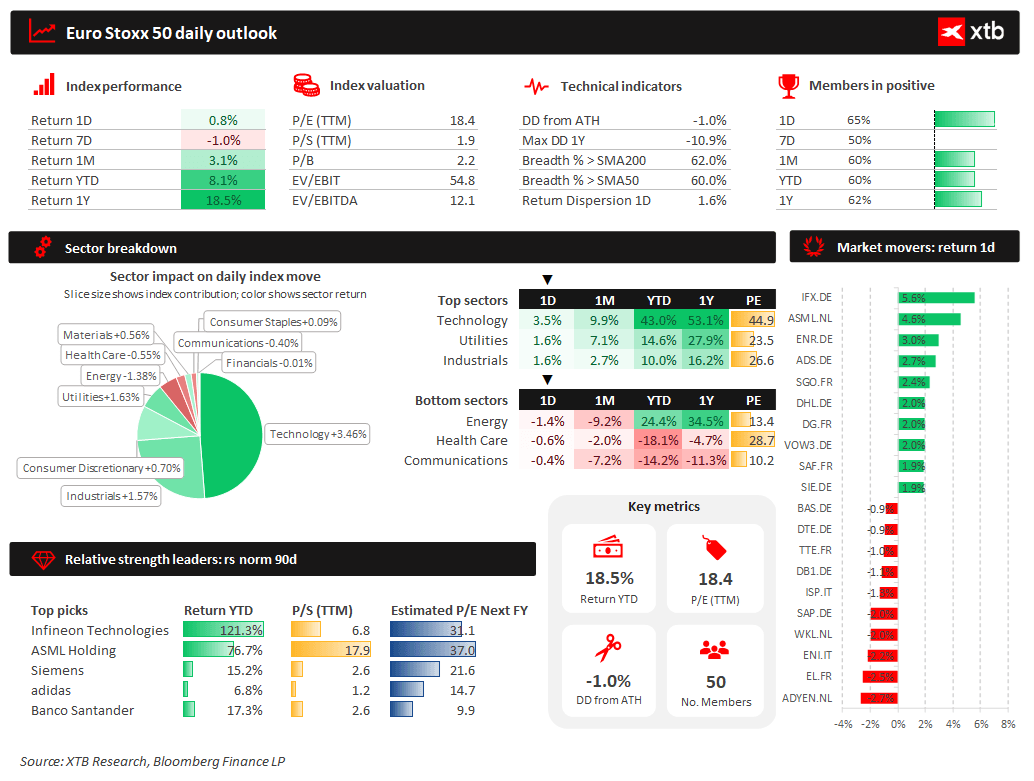
Thanks to a strong improvement in sentiment based on solid growth in the advanced technology sector, the most important European stock indices are making significant gains. The aforementioned pan-European Euro Stoxx 50 is strengthening by 0.8%, increasing its total gain in 2026 to 18.5%. Figure 3: Dashboard for Euro Stoxx 50 (25.06.2026)
Source: XTB Research, 25.06.2026
The German DAX (+1%), the French CAC 40 (+0.7%), the British FTSE 100 (+0.9%), and the Polish WIG20 (+1.4%) are also strengthening. Futures contracts also suggest that the American stock market should open in the green. Geopolitics In recent days, geopolitical issues have moved to the background. Work is underway on signing a final agreement, for which both sides have until 21 August. However, from previous experience, we know that deadlines set by President Trump tend to be flexible – we would therefore not become overly attached to this date. Breakthrough information still has significant potential to trigger high volatility in the markets. However, the bar for its “breakthrough” status is set much higher than in the first weeks of the conflict. The market expects concrete actions and is meticulously tracking whether traffic in the Strait of Hormuz will indeed be restored to a state close to normal.
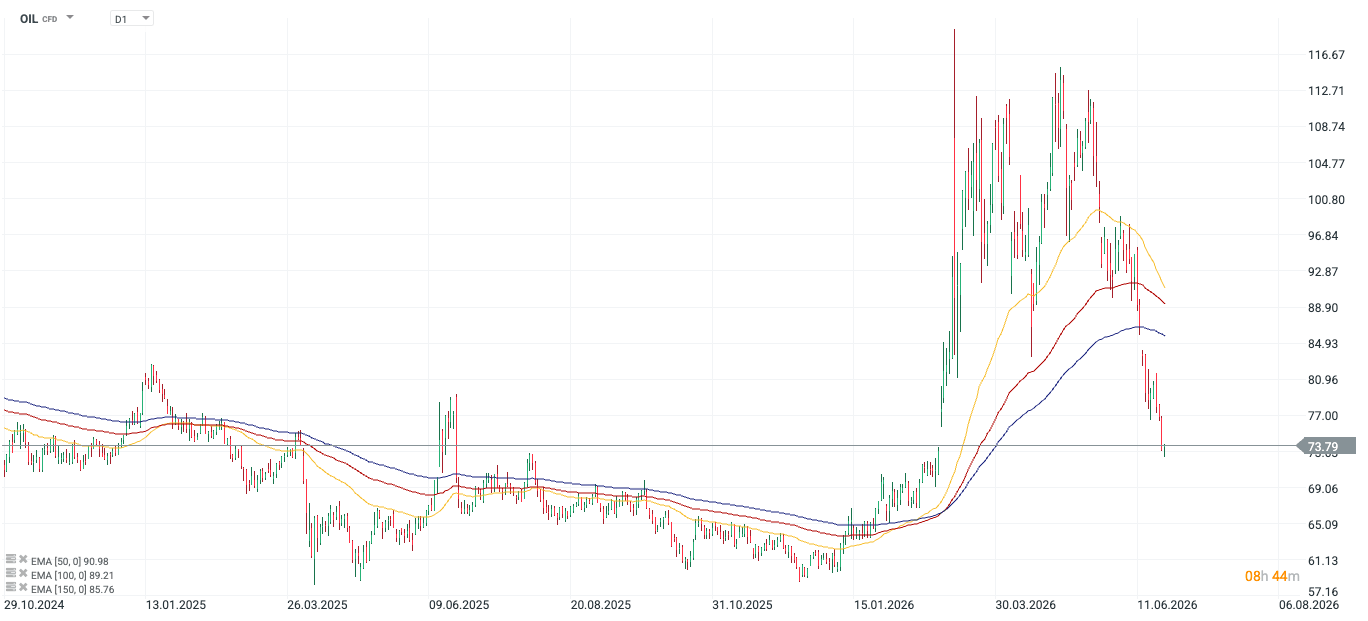
Commodities In the absence of negative headlines, key energy commodities continue to decline.
- Brent crude oil is falling to $73 per barrel.
- We will buy a barrel of WTI crude oil for less than $70.
Figure 4: OIL [D1] (29.10 – 25.06)
Source: xStation, 25.05.2026
Macroeconomic Data
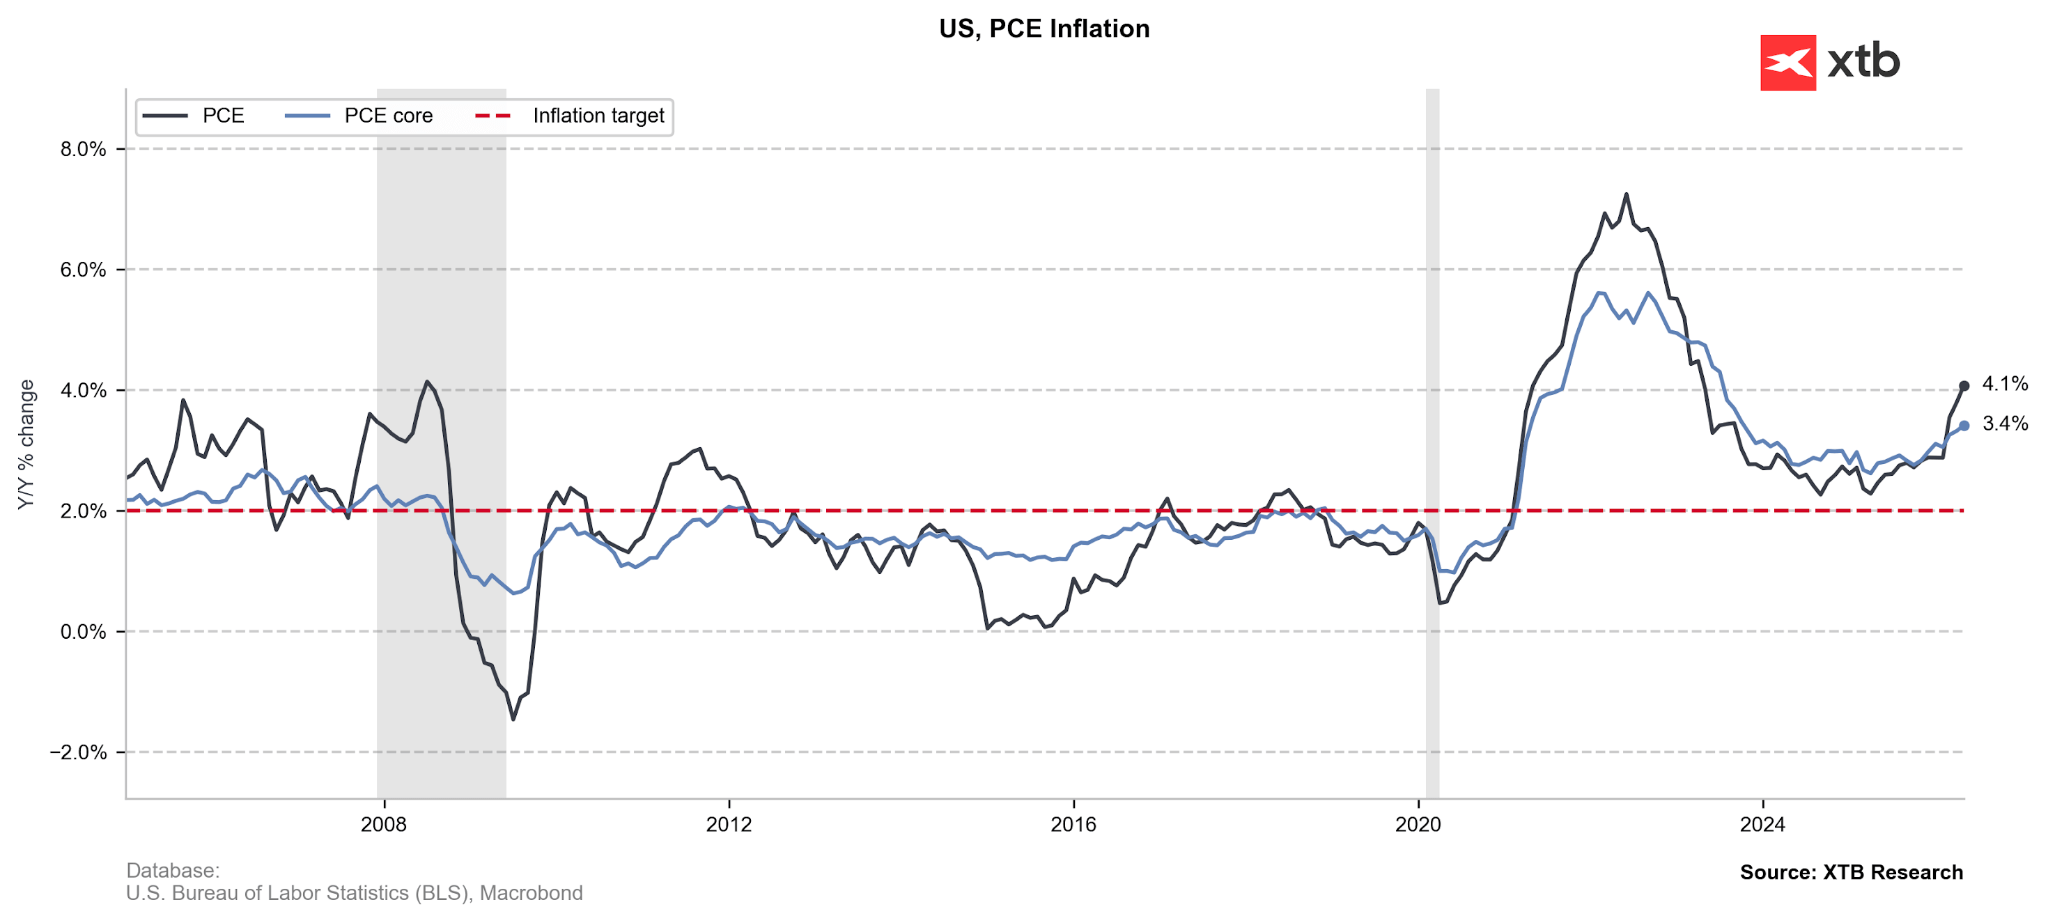
We have behind us the publication of key PCE inflation data from the United States. There were no major surprises, and valuations for Fed interest rate hikes were only modestly revised downwards. Both the headline and core measures were in line with annual expectations:
- Headline PCE: 4.1%.
- Core PCE: 3.4%.
Figure 5: PCE Inflation in the United States (2006 – 2026)
Source: XTB Research, 25.06.2026
A slight surprise was noted only on a monthly basis – and this in the range of the currently less significant headline measure.
- Headline PCE: 0.4% (consensus: 0.5%).
- Core PCE: 0.3%.
Attention has therefore turned to other readings published at the same time.
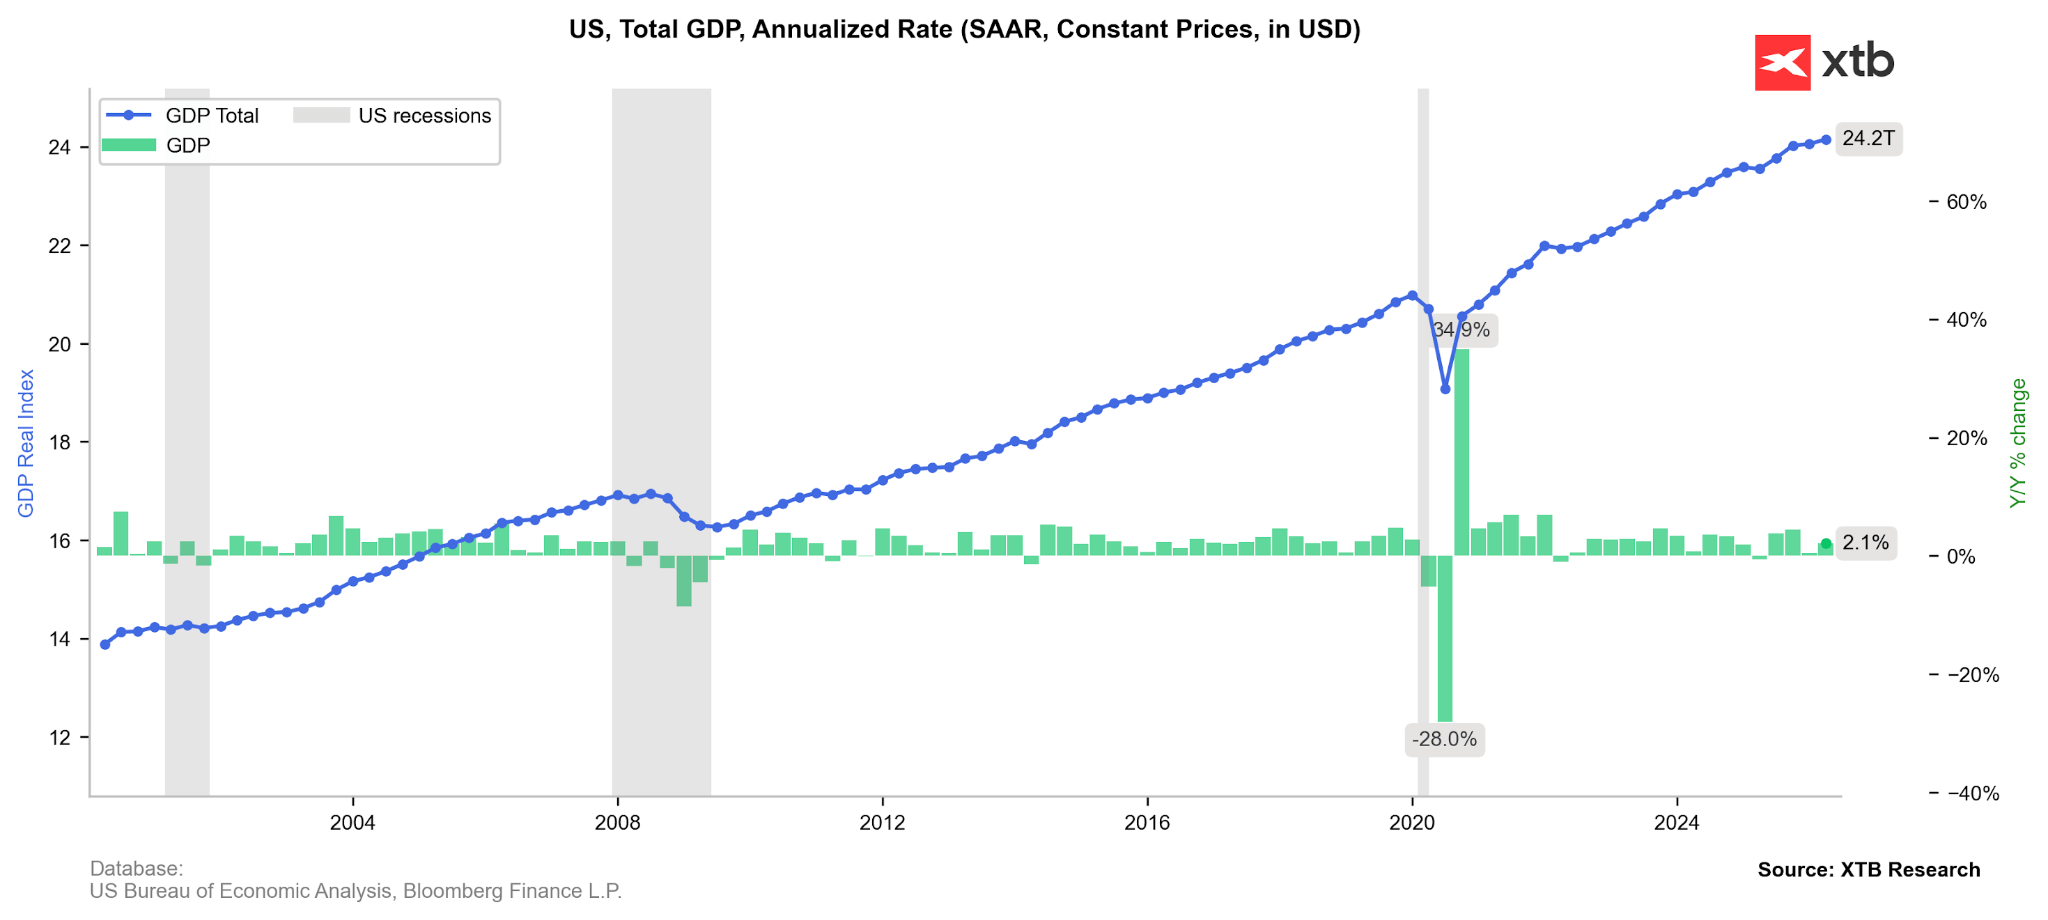
- Particularly interesting seems to be the revision of GDP growth for Q1 from 1.6% on an annualised basis to 2.1%.
- A pleasant surprise is also the higher-than-expected growth in income and consumer spending in May (both up 0.7% on a monthly basis).
Figure 6: GDP and GDP Growth in the United States (2000 – 2026)
Source: XTB Research, 25.06.2026
Currencies
The high expectations that investors placed on the publication of today’s US inflation report were not met. The reading did not prove to be a breakthrough, and the issue of interest rate hikes in the United States remains open. The EURUSD pair, after a 2.5% drop over the last week, remains stable today, oscillating around 1.135. Figure 7: EURUSD [H1] (02.06 – 25.06)
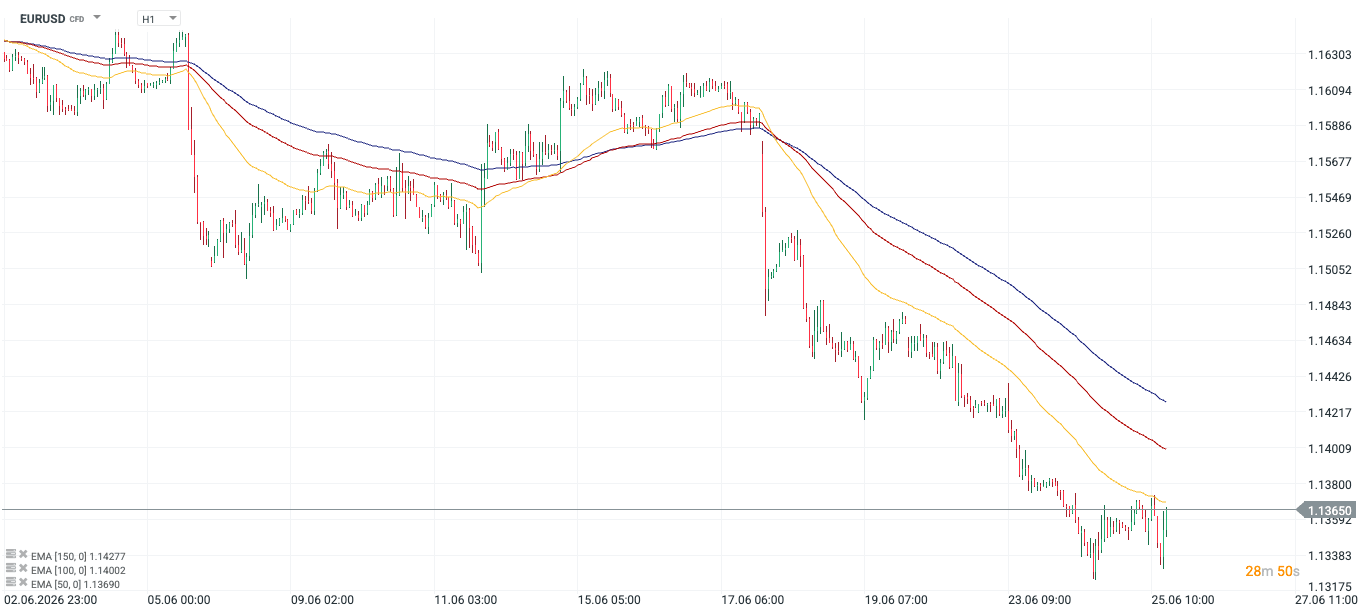
Source: xStation, 25.06.2026