S&P 500 — US Large Cap Index
 FTSE 100 — UK Blue Chips
 Euro Stoxx 50 — Eurozone Leaders
 DAX 40 — German Equities
 CAC 40 — French Market Index
 Nikkei 225 — Japan Benchmark
 Hang Seng — Hong Kong Index
 Shanghai Composite — China Mainland
 ASX 200 — Australian Market
 TSX Composite — Canada Index
 Nifty 50 — India Large Cap
 STI Index — Singapore Market
 KOSPI — South Korea Index
 Bovespa — Brazil Equities
 JSE Top 40 — South Africa Index
 IPC Index — Mexico Market
Nasdaq loses 2% amid Fed fears, AI trade and uncertainty around the US – Iran deal


Wall Street is entering the session under pressure from a broad wave of profit-taking, with the technology sector once again at the center of the selloff. Nasdaq 100 futures are down more than 2% as investors increasingly question whether the AI-driven rally can be sustained amid rising expectations for further Federal Reserve rate hikes. Markets are becoming concerned that higher borrowing costs could weigh on companies funding massive AI infrastructure investments through debt.
Micron and PCE: A Test of Market Strength?
Markets are now pricing in a cumulative 50 basis points of Fed rate hikes by December, compared with expectations of only one 25-basis-point increase just two weeks ago. The biggest challenge for the broader AI trade is a combination of elevated valuations following a powerful rally and growing concerns that financing AI infrastructure could become significantly more expensive.
- Pressure is also spreading to semiconductor stocks, despite the Philadelphia Semiconductor Index (SOX) reaching a record high only a day earlier. Alphabet, Meta, Microsoft, and Amazon all posted sharp declines in the previous session, confirming that profit-taking is extending across the broader megacap technology complex.
- While investors continue to monitor developments surrounding Iran, interest rates and valuations remain the primary source of market anxiety rather than geopolitics. The key event of the week will be Friday’s PCE inflation report. Economists expect the Fed’s preferred inflation gauge to rise to 4.1%, more than double the central bank’s target.
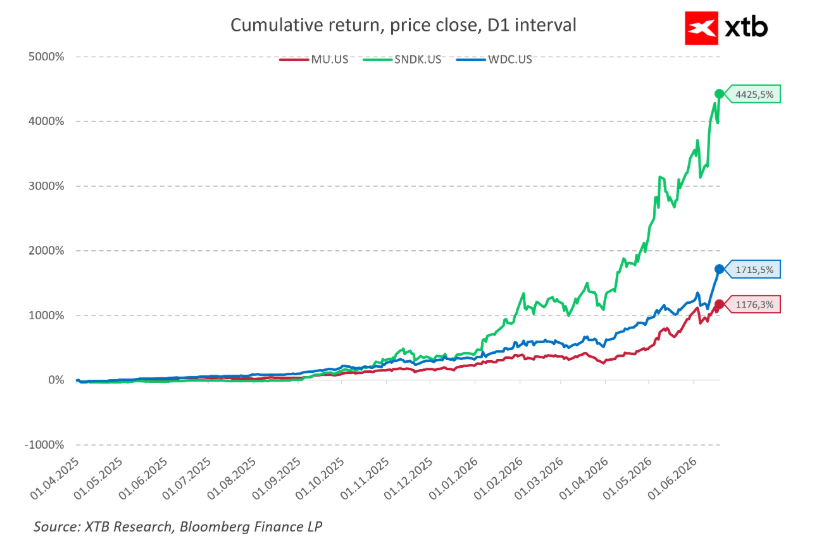
- Micron’s earnings report, scheduled for release after Wednesday’s U.S. market close, could become a crucial test of investor sentiment toward memory chips and AI-related semiconductors. Alongside SanDisk, Micron has been one of the biggest beneficiaries of the boom in memory-chip demand. Additional concerns emerged after SpaceX tapped the bond market shortly after its blockbuster IPO despite reporting net losses the previous year. The stock has already erased most of its gains since the June 12 listing.
The chart below illustrates the extraordinary returns generated by leading memory-chip companies since April 1, 2025, highlighting just how aggressively investors have positioned themselves around the AI infrastructure theme.
Source: xStation5 US100 Chart (D1 Interval)
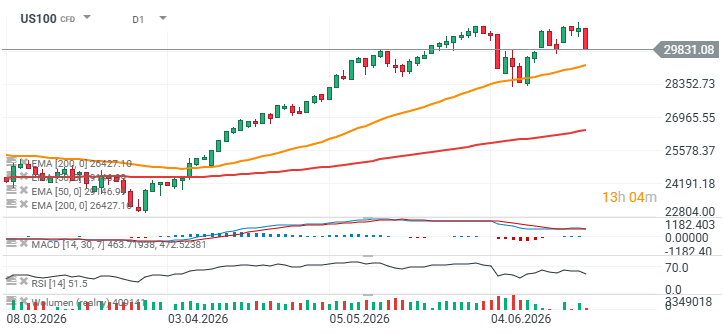
Part of the recent selling pressure may be linked to portfolio rebalancing ahead of the end of June. In a recent analysis, J.P. Morgan suggested that institutional funds could sell more than $100 billion worth of equities in the coming weeks. Notably, the pullback began shortly after the Nasdaq 100 approached record highs near the 31,000-point level, potentially forming a double-top pattern. If a classic 1:1 correction scenario unfolds, a move toward the 28,000-point area cannot be ruled out. On the other hand, bullish momentum could find support around the 50-day exponential moving average (EMA50), currently located near 29,200 points and marked by the orange line on the chart.
Source: xStation5