- NZD/JPY trades near the 85.70 zone with minor gains on Friday.
- The pair maintains a bearish outlook despite mixed technical signals.
- Key support is clustered below 85.60, with resistance near 86.00.
The NZD/JPY pair is attempting to hold on to modest gains as it trades near the 85.70 zone ahead of the Asian session on Friday. Despite the slight uptick, the broader technical picture remains tilted to the downside, reflecting the influence of longer-term bearish signals that have kept the pair within a tight range recently. Traders appear hesitant to push the pair significantly higher, reflecting a cautious tone as they assess the balance of technical indicators.
NZD/JPY presents a complex technical backdrop, with short-term signals offering a mixed picture. The 20-day Simple Moving Average (SMA) currently points to a buy signal, reflecting recent strength. However, this is overshadowed by the 100-day and 200-day SMAs, both indicating a bearish outlook, highlighting the broader downward pressure. The 10-day Exponential Moving Average (EMA) and 10-day SMA, also positioned in the 80s, reinforce this bearish view, aligning with the longer-term trend.
Momentum indicators provide a similarly mixed signal. The Relative Strength Index (RSI) is in the 50s, suggesting neutral momentum, while the Moving Average Convergence Divergence (MACD) signals mild buy pressure, adding a hint of bullish potential. However, the Stochastic %K (14, 3, 3) remains in the 40s, indicating a more cautious stance, while the Commodity Channel Index (20) also signals neutrality, confirming the lack of a clear directional bias. The Average Directional Index (14), positioned around 15, underscores this neutral tone, indicating a market lacking strong trend conviction.
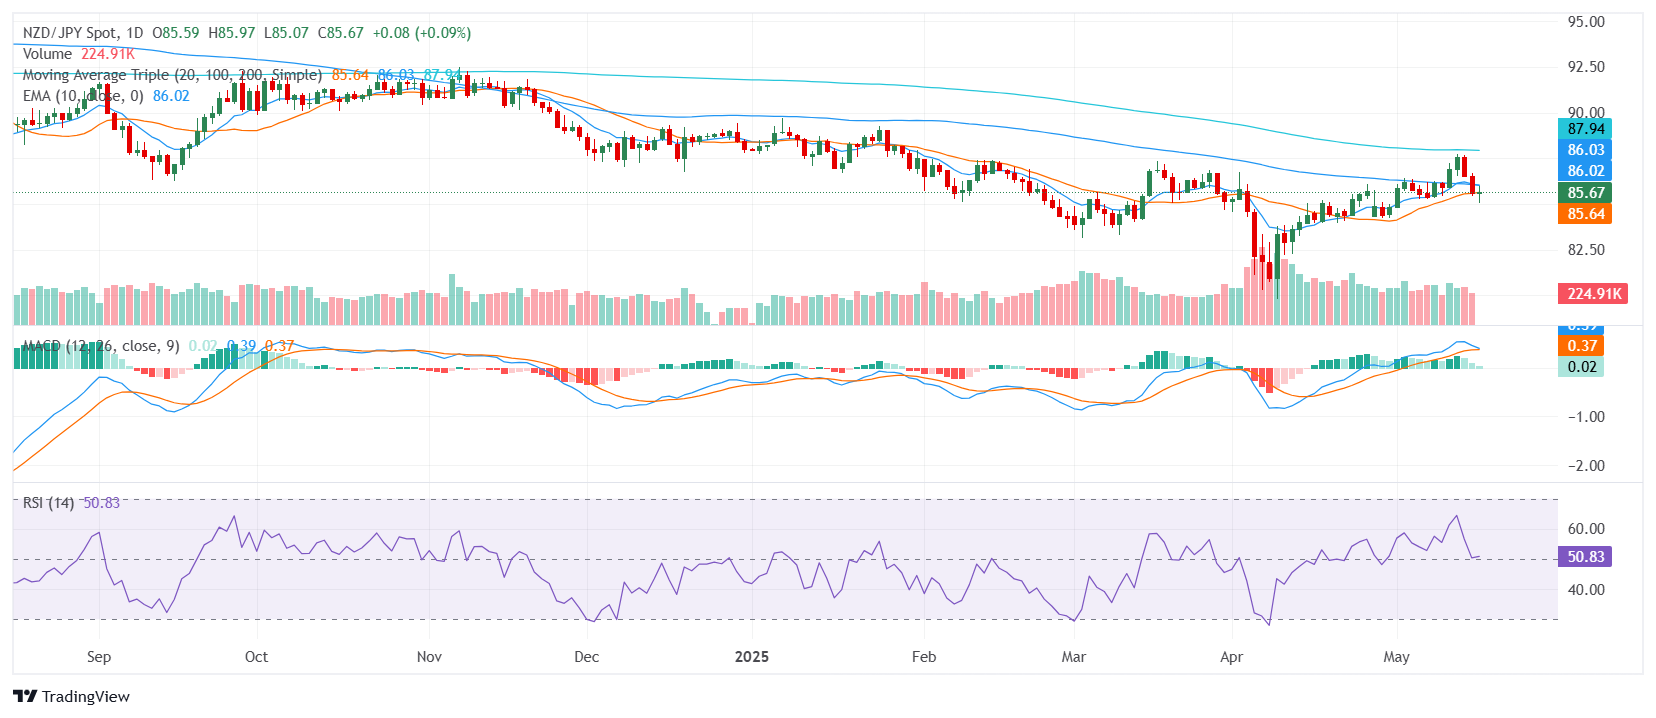
For now, immediate support is seen around 85.64, with additional layers at 85.51 and 85.50. On the upside, resistance is likely to emerge around 85.70, followed closely by 85.77 and 86.03, potentially limiting any recovery attempts in the near term.
Daily Chart