NZD/USD Extends rejection slide from 50% Fibo.; drops to 0.5900 neighbourhood
- NZD/USD drifts lower despite stronger NZD CPI print and snaps a six-day winning streak.
- A modest USD uptick fails to assist spot prices to make it through the 50% Fibo. level.
- The bullish technical setup supports prospects for the emergence of some dip-buying.
The NZD/USD pair retreats from the vicinity of mid-0.5900s, or a fresh year-to-date high touched during the Asian session this Thursday, in reaction to stronger-than-expected consumer inflation figures from New Zealand. Spot prices drop to the 0.5900 neighbourhood in the last hour and for now, seem to have snapped a six-day winning streak amid a modest US Dollar (USD) uptick.
Furthermore, the fact that the Consumer Price Index (CPI) remained comfortably within the Reserve Bank of New Zealand’s (RBNZ) 1–3% target range for a third consecutive quarter failed to shift expectations of further easing. This undermines the New Zealand Dollar (NZD) and contributes to the NZD/USD pair’s slide from the 50% Fibonacci retrancement level of the September 2024-April 2025 downfall.
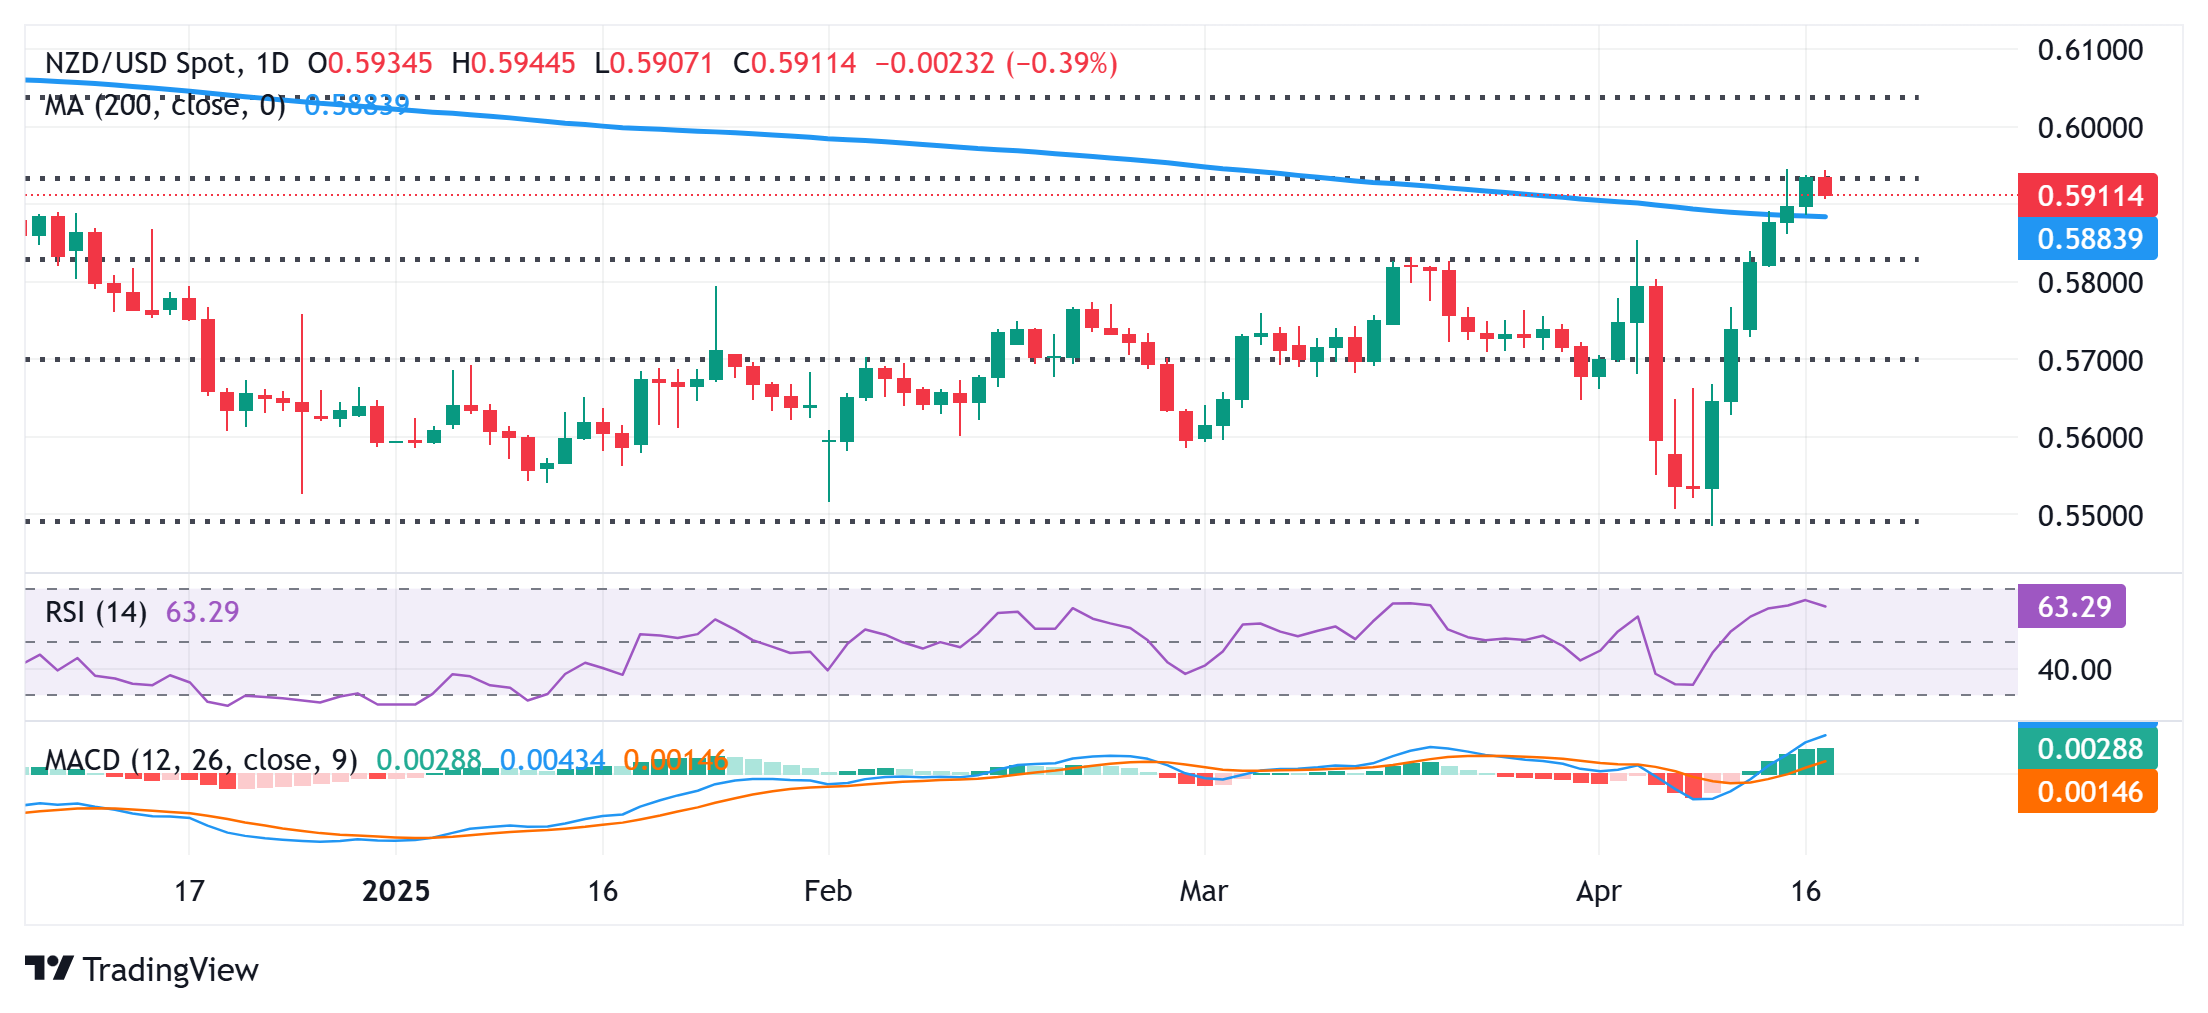
Meanwhile, the recent breakout through the very important 200-day Simple Moving Average (SMA) for the first time since October 2024 was seen as a key trigger for bullish traders. Moreover, oscillators on the daily chart are holding comfortably in positive territory and are still away from being in the overbought zone. This, in turn, suggests that the path of least resistance for the NZD/USD pair is to the upside.
Hence, any subsequent fall might still be seen as a buying opportunity near the 0.5860-0.5855 region. This is closely followed by the 200-day SMA, currently around the 0.5840 zone, and the 0.5825 region, or the 38.2% Fibo. level, which should help limit any further decline. A convincing break below the latter, however, might prompt technical selling and drag the NZD/USD pair towards testing sub-0.5800 levels.
On the flip side, bulls might wait for sustained strength and acceptance above the 50% Fibo. level, around the 0.5930 region, before placing fresh bets. The NZD/USD pair might then accelerate the positive momentum towards the 0.5970 horizontal resistance en route to the 0.6000 psychological mark and the 61.8% Fibo. level, around the 0.6040 area.
NZD/USD daily chart