S&P 500 — US Large Cap Index
 FTSE 100 — UK Blue Chips
 Euro Stoxx 50 — Eurozone Leaders
 DAX 40 — German Equities
 CAC 40 — French Market Index
 Nikkei 225 — Japan Benchmark
 Hang Seng — Hong Kong Index
 Shanghai Composite — China Mainland
 ASX 200 — Australian Market
 TSX Composite — Canada Index
 Nifty 50 — India Large Cap
 STI Index — Singapore Market
 KOSPI — South Korea Index
 Bovespa — Brazil Equities
 JSE Top 40 — South Africa Index
 IPC Index — Mexico Market
SK Hynix Earnings – Is The market over-sold?

The Korean DRAM memory supplier and Micron’s main competitor released its results for Q2 2026. Despite extremely strong profit growth, the company suffered a valuation drop of as much as 9%.
Key metrics
- Revenue: The market expected about ₩84 billion, but the company delivered “only” ₩79.3 billion.Despite the disappointment, it is still up 257% year over year.
- Despite the disappointment, it is still up 257% year over year.
- Operating profit: Management reported ₩60.54 billion versus expectations of about ₩64 billion.That is a staggering 557% year-over-year increase, but still “as much as” 5% below consensus.
- That is a staggering 557% year-over-year increase, but still “as much as” 5% below consensus.
- Margin: The only clear reassurance for investors may have been the operating margin, which nevertheless met expectations, reaching 76.3% (up about 5 percentage points quarter over quarter).
Despite mild disappointments in the headline financial figures, there are reasons for optimism in the sales data.
- DRAM and NAND sales (quarter over quarter) rose by several to low double digits, with average price increases of 30% to 50%, depending on the segment.
- Enterprise-class SSD sales doubled quarter over quarter.
- The most mixed area is also the most promising segment: HBM4 memory. The company is currently still in the “final stretch” toward mass production, at least based on management’s assurances.Delays in this segment are clearly weighing on results and sentiment.
- Delays in this segment are clearly weighing on results and sentiment.
- Another perceived issue may be the company’s cash position, not its size, but rather the lack of transfers to shareholders.Management promised a cash distribution plan for shareholders by year-end, but has not provided specifics.
- Management promised a cash distribution plan for shareholders by year-end, but has not provided specifics.
Guidance
For Q3, management is guiding for 10% DRAM volume growth (q/q) and a similar increase in NAND, accelerated HBM4 production, and CAPEX not exceeding ₩50 billion. These declarations are slightly below investor expectations, but imply only moderate pricing pressure.
Conclusion
The company’s results were objectively good, even very good. But in the current market context, “good” is not enough. A key concept for valuing “hyper-growth” companies, which currently include SK Hynix and Micron, is the so-called terminal value. With growth expectations in the hundreds of percent and high valuation multiples, even a small miss versus expectations implies increasing (nominal) differences over time in the company’s implied terminal value. The biggest issue with this concept, and a sort of consolation for shareholders, is that this mechanism no longer fully explains the share price reaction to the results, which may indicate an irrational nature of the sell-off. A sell-off driven more by sentiment or speculation than by real operational or strategic problems. It would be very optimistic, if not naive, to expect the company to maintain its current growth pace over several years. However, the current share price already reflects a meaningful amount of risk regarding the quality of future earnings releases.
SK Hynix Price vs EPS Expectations
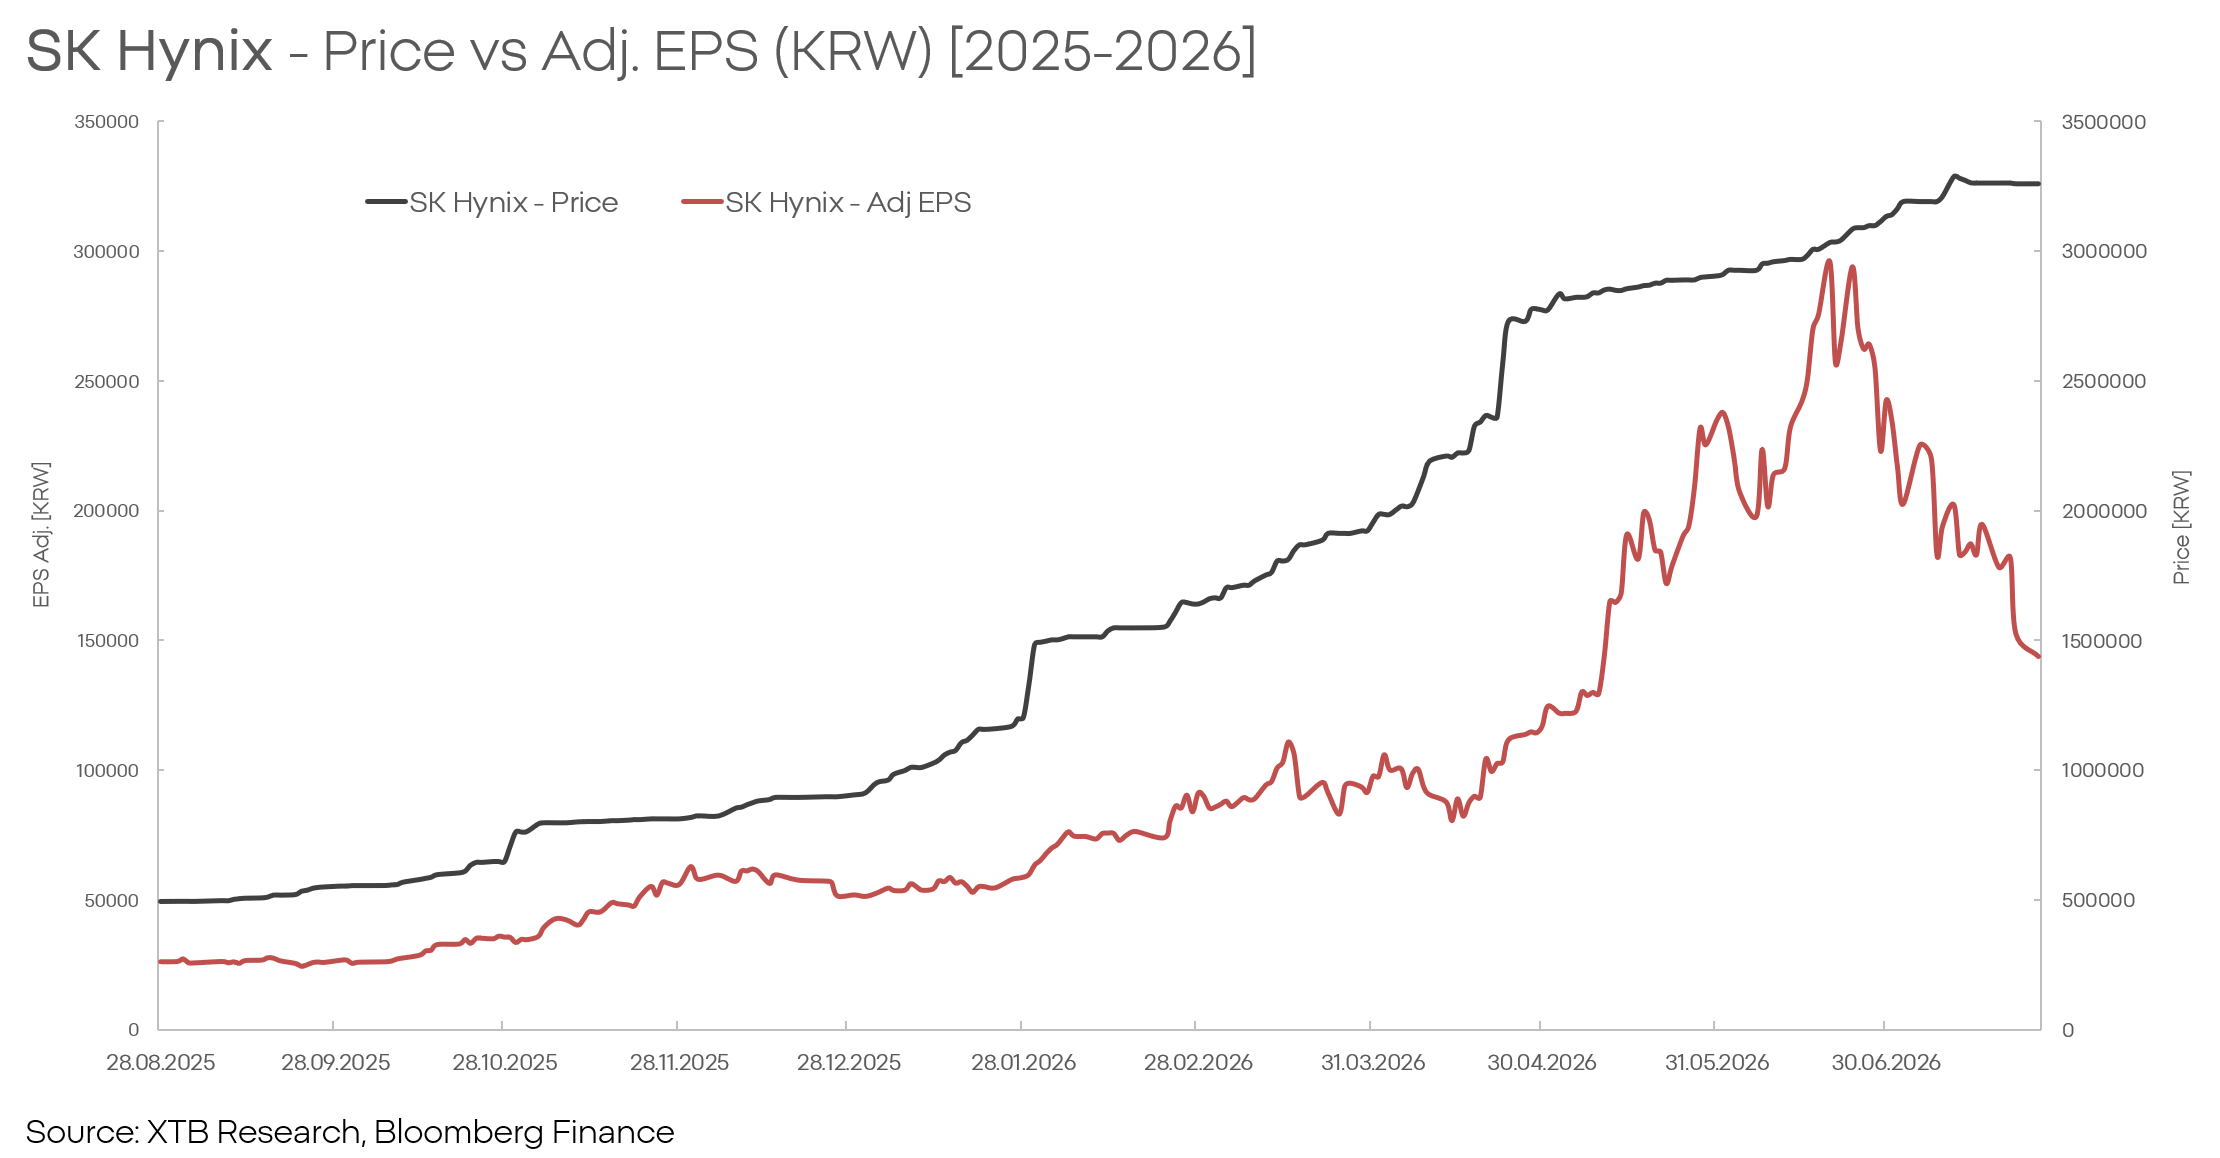
Looking at the relationship between the market’s EPS consensus and the share price, one can see that the price has already pulled back to the late March/early April level, even though results remain multiples higher and should, at least for some time, continue their hyperbolic growth. Technical and valuation view:
- P/E is currently about 13.Forward P/E is currently just under 4.
- Forward P/E is currently just under 4.
- PEG (P/E divided by forecast EPS growth rate) is about 0.1.For context, values below 1 imply a stock that is “cheap” relative to its growth rate.
- For context, values below 1 imply a stock that is “cheap” relative to its growth rate.
- Technically, RSI around ~35 indicates oversold levels.