S&P 500 — US Large Cap Index
 FTSE 100 — UK Blue Chips
 Euro Stoxx 50 — Eurozone Leaders
 DAX 40 — German Equities
 CAC 40 — French Market Index
 Nikkei 225 — Japan Benchmark
 Hang Seng — Hong Kong Index
 Shanghai Composite — China Mainland
 ASX 200 — Australian Market
 TSX Composite — Canada Index
 Nifty 50 — India Large Cap
 STI Index — Singapore Market
 KOSPI — South Korea Index
 Bovespa — Brazil Equities
 JSE Top 40 — South Africa Index
 IPC Index — Mexico Market
Facts:
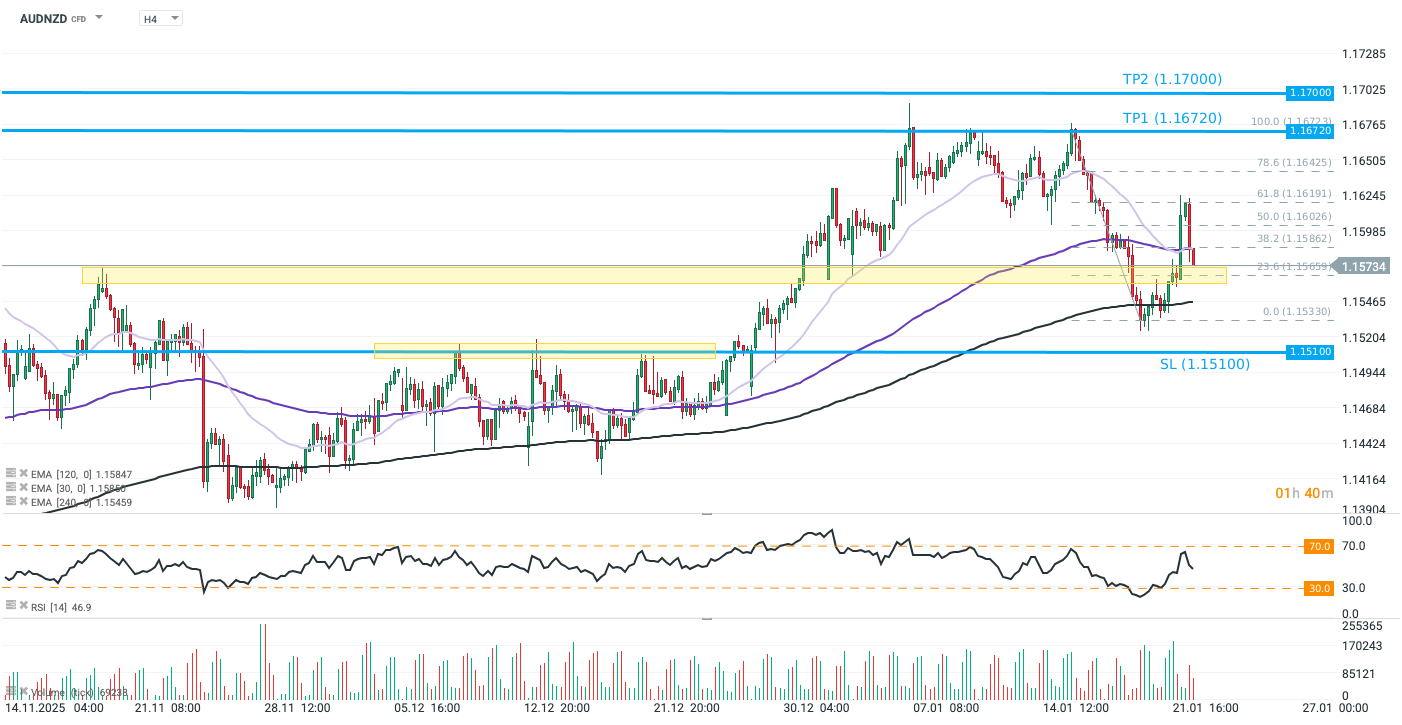
- AUDNZD rebounded this week from the 240-period exponential moving average (EMA240) on the H4 timeframe. The price remains above the November 20, 2025 high, with a neutral RSI in the 47–48 range.
- The probability of an interest rate hike in Australia in February, implied by Cash Rate Futures, stands at 58.4% (source: Bloomberg).
- Australia’s unemployment rate unexpectedly fell in December to 4.1% from 4.3% in November (Bloomberg consensus: 4.4%).
Recommendation:
- Long position (BUY) on AUDNZD at market price
- Take Profit (TP): 1.16720 (TP1), 1.17000 (TP2)
- Stop Loss (SL): 1.15100
Source: xStation5
Opinion:
AUDNZD has recently seen its uptrend capped, mainly due to signs of economic recovery in New Zealand. However, today’s Australian labor market data once again tilt monetary policy expectations in favor of the AUD. The unexpected drop in unemployment (to 4.1%; forecast: 4.4%, previous: 4.3%), combined with a stronger-than-expected rebound in employment in December, presents a renewed challenge for the Reserve Bank of Australia (RBA), which has kept rates unchanged at 3.6% since August.
With a tightening labor market, elevated inflation poses a more serious long-term risk, potentially translating into wage pressures. Markets currently price in around a 58% probability of a 25 bp rate hike in February. The monthly CPI inflation print due next week is unlikely to materially alter longer-term expectations for the RBA, particularly as continued expansion in business activity (PMIs above 50) should limit any sharp slowdown in price momentum.
Moreover, the RBA has consistently emphasized its preference for quarterly inflation data. The latest Q3 reading exceeded expectations (3.2% vs. 3.0% consensus), while inflation readings for October–December remained clearly above the RBA’s target (3.5%, 3.8%, and 3.4%, respectively).
Overall, a stronger labor market significantly raises the cost and risk of delaying the next RBA rate hike. As a result, upside pressure on AUDNZD should rebuild, despite better data from New Zealand (November employment up 0.3% m/m), which reinforce expectations that the RBNZ will pause its easing cycle.
From a technical perspective, a sustained move back above the 30- and 120-period moving averages, along with a break above the 50% Fibonacci retracement, would be key conditions for resuming the uptrend. The main short-term risk would be a decline below the 23.6% Fibonacci retracement, although EMA240 should provide final support, even if New Zealand’s inflation data later tonight surprise to the upside.
Methodology:
This recommendation is based on technical analysis of the AUDNZD chart and fundamental analysis of the Australian and New Zealand economies, with a focus on monetary policy dynamics. The trade direction was determined using exponential moving averages (a bullish rebound from EMA240) and market expectations for central bank policy.
Take Profit and Stop Loss levels were defined using Price Action techniques and Fibonacci retracements:
- TP1 at the recent higg
- TP2 near the psychological 1.17000 level
- SL at the upper boundary of the recent consolidation range