S&P 500 — US Large Cap Index
 FTSE 100 — UK Blue Chips
 Euro Stoxx 50 — Eurozone Leaders
 DAX 40 — German Equities
 CAC 40 — French Market Index
 Nikkei 225 — Japan Benchmark
 Hang Seng — Hong Kong Index
 Shanghai Composite — China Mainland
 ASX 200 — Australian Market
 TSX Composite — Canada Index
 Nifty 50 — India Large Cap
 STI Index — Singapore Market
 KOSPI — South Korea Index
 Bovespa — Brazil Equities
 JSE Top 40 — South Africa Index
 IPC Index — Mexico Market

Facts:
- The price is above the EMA 5, 20, 100, and 200 averages.
- EMA 100 is above EMA 200.
- RSI [14] is around 68.
- The MACD line is above the signal line.
- The price has broken above a local high at around 710.
- The USDA forecast indicates consumption exceeding supply by 7 million tons.
Recommendation:
- Long position (Buy) on WHEAT at market price.
- Target price (Take Profit, TP): 785
- Stop Loss (SL): 684
WHEAT (D1)
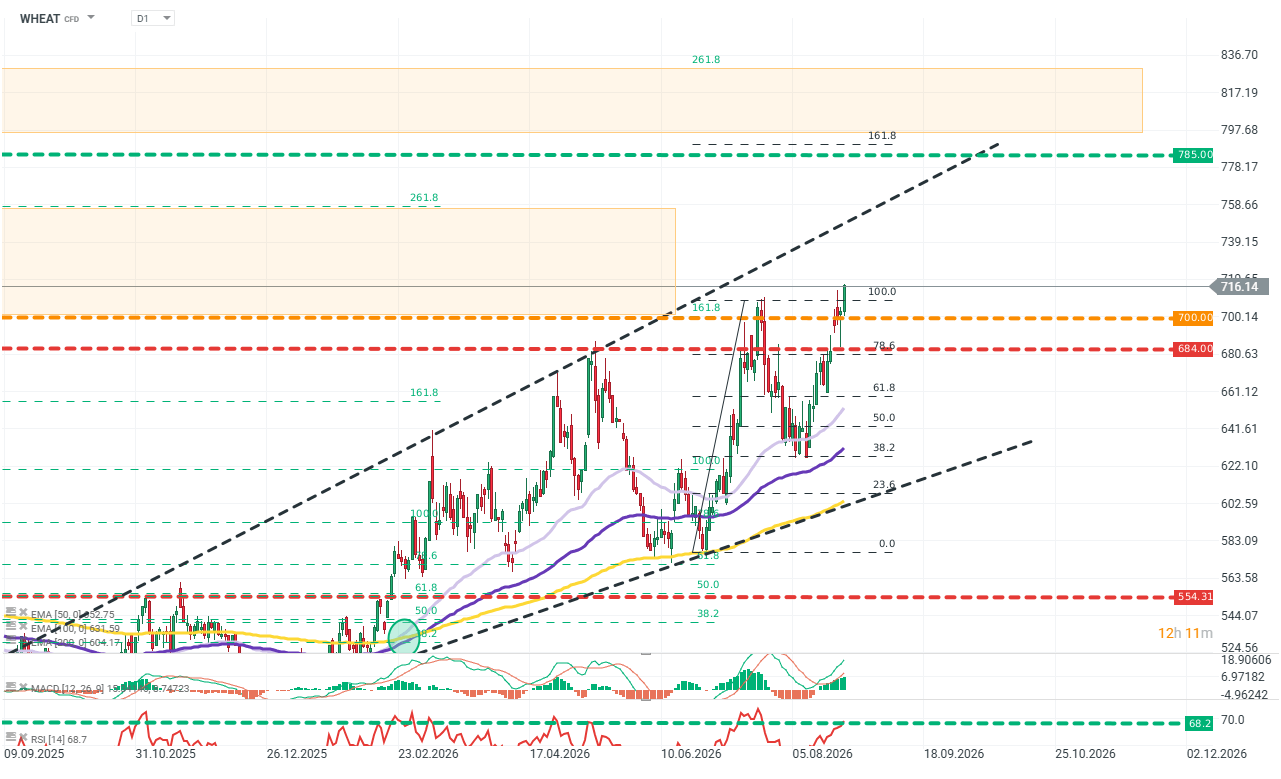
Source: xStation5 OPINION : The wheat (WHEAT) chart currently shows a forming opportunity from both a technical and fundamental perspective. Despite strong gains in recent weeks, driven by concerns about exports via the Black Sea, the price has surpassed the latest peak, confirming strong demand and an upward trend. The uptrend is confirmed by the EMA alignment and MACD. The base scenario is for the price to continue following the upper boundary of the expanding rising channel toward the 161 Fibonacci extension of the last upward wave, below which the TP level is located. From a fundamental perspective, wheat also retains upside arguments, as the conflict in Ukraine is only one of many supply factors. Production in the US is expected to decline, and in India the monsoon season has turned out to be exceptionally dry.
Methodology and assumptions:
- The recommendation is based on technical chart analysis, in particular EMAs, Fibonacci levels, and fundamental analysis of the wheat market.
- The target level was determined based on Fibonacci levels.
- The protective stop loss order was set based on a favorable risk to reward ratio and based on a Fibonacci level.