S&P 500 — US Large Cap Index
 FTSE 100 — UK Blue Chips
 Euro Stoxx 50 — Eurozone Leaders
 DAX 40 — German Equities
 CAC 40 — French Market Index
 Nikkei 225 — Japan Benchmark
 Hang Seng — Hong Kong Index
 Shanghai Composite — China Mainland
 ASX 200 — Australian Market
 TSX Composite — Canada Index
 Nifty 50 — India Large Cap
 STI Index — Singapore Market
 KOSPI — South Korea Index
 Bovespa — Brazil Equities
 JSE Top 40 — South Africa Index
 IPC Index — Mexico Market
- USD/JPY trades sideways around 158.50 as both the US Dollar and the Japanese Yen trade firmly.
- The Yen gains ground after Japanese officials warn of intervention against one-way excessive moves.
- The speculation for the Fed holding interest rates steady in the January policy meeting has strengthened the US Dollar.
The USD/JPY pair trades in a tight range around 158.50 during the Asian trading session on Thursday. The pair consolidates as the upbeat US Dollar (USD) has offset the decent recovery in the Japanese Yen (JPY).
Japanese Yen Price Today
The table below shows the percentage change of Japanese Yen (JPY) against listed major currencies today. Japanese Yen was the strongest against the New Zealand Dollar.
| USD | EUR | GBP | JPY | CAD | AUD | NZD | CHF | |
|---|---|---|---|---|---|---|---|---|
| USD | 0.05% | 0.05% | -0.05% | 0.10% | 0.19% | 0.23% | 0.03% | |
| EUR | -0.05% | -0.00% | -0.11% | 0.05% | 0.13% | 0.18% | -0.02% | |
| GBP | -0.05% | 0.00% | -0.11% | 0.05% | 0.14% | 0.18% | -0.02% | |
| JPY | 0.05% | 0.11% | 0.11% | 0.13% | 0.23% | 0.25% | 0.08% | |
| CAD | -0.10% | -0.05% | -0.05% | -0.13% | 0.10% | 0.13% | -0.06% | |
| AUD | -0.19% | -0.13% | -0.14% | -0.23% | -0.10% | 0.05% | -0.15% | |
| NZD | -0.23% | -0.18% | -0.18% | -0.25% | -0.13% | -0.05% | -0.20% | |
| CHF | -0.03% | 0.02% | 0.02% | -0.08% | 0.06% | 0.15% | 0.20% |
The heat map shows percentage changes of major currencies against each other. The base currency is picked from the left column, while the quote currency is picked from the top row. For example, if you pick the Japanese Yen from the left column and move along the horizontal line to the US Dollar, the percentage change displayed in the box will represent JPY (base)/USD (quote).
Japan’s currency gains ground after remaining downbeat in the past few weeks amid fears of intervention. Japan Chief Cabinet Secretary Seiji Kihara said on Wednesday that the government could intervene due to one-way excessive moves against the JPY.
However, the recovery move in the Japanese currency is expected to remain capped, with Prime Minister Sanae Takaichi’s trade remaining in traction.
Market experts are pricing in the victory of Takaichi in the early snap election, which she is expected to announce next week after dissolving the parliament’s lower house, Reuters reported. Takaichi’s win will help her get support for his budget, which is expected to be equipped with higher spending plans, an event that is favorable for Japanese equity markets and a headwind to the currency.
Meanwhile, the US Dollar Index (DXY) holds onto gains near the monthly high of 99.26 amid expectations that the Federal Reserve (Fed) will leave interest rates unchanged in the policy meeting later this month.
USD/JPY technical analysis
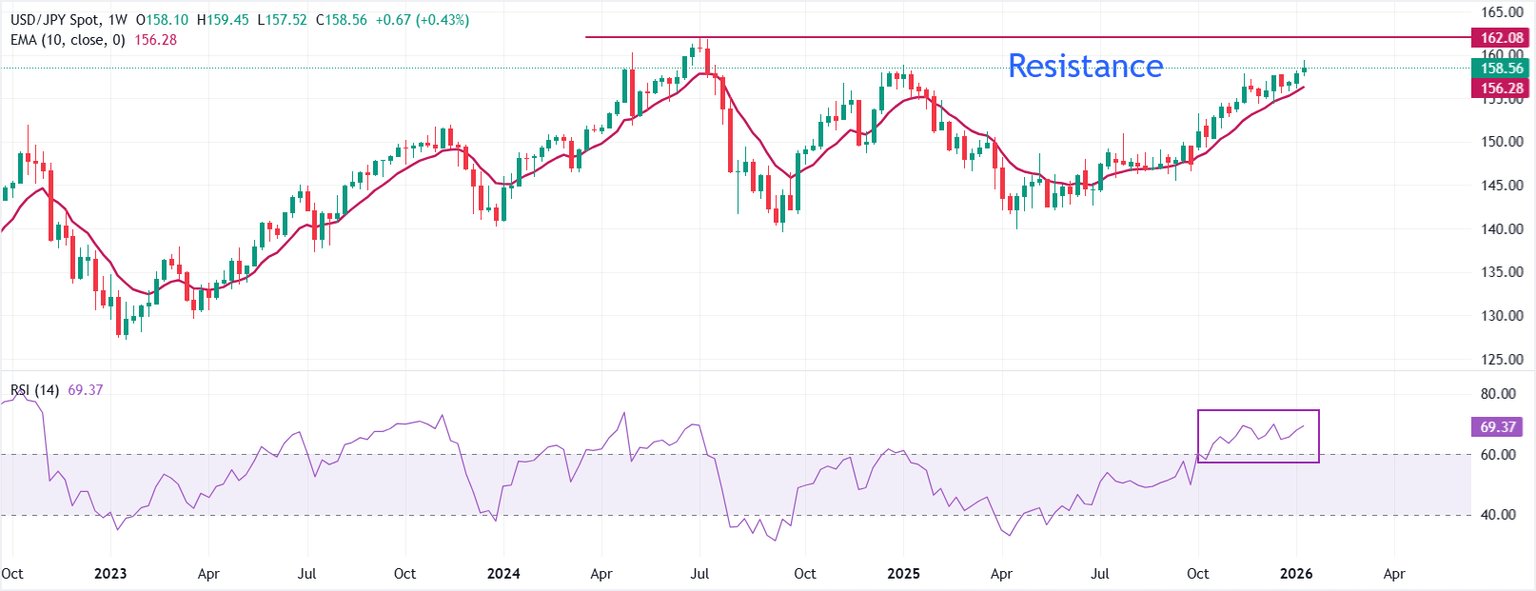
USD/JPY trades almost flat at around 158.56 during the press time. Price holds well above the rising 10-week Exponential Moving Average (EMA), reinforcing a strong uptrend. The 10-week EMA’s steady climb supports dips and keeps pressure on the topside.
The 14-week Relative Strength Index (RSI) at 69.37, near overbought, confirms firm momentum but signals stretched conditions. Initial support stands at the 10-week EMA at 156.28.
While above the trend EMA, the advance could extend, with setbacks expected to be contained by dynamic support. A brief pullback would help cool RSI from near-overbought and sustain the broader move. A weekly close below 156.28 would weaken the bullish structure and open room for a deeper retracement.