S&P 500 — US Large Cap Index
 FTSE 100 — UK Blue Chips
 Euro Stoxx 50 — Eurozone Leaders
 DAX 40 — German Equities
 CAC 40 — French Market Index
 Nikkei 225 — Japan Benchmark
 Hang Seng — Hong Kong Index
 Shanghai Composite — China Mainland
 ASX 200 — Australian Market
 TSX Composite — Canada Index
 Nifty 50 — India Large Cap
 STI Index — Singapore Market
 KOSPI — South Korea Index
 Bovespa — Brazil Equities
 JSE Top 40 — South Africa Index
 IPC Index — Mexico Market
- Silver struggles to capitalize on the previous day’s strong move up.
- A breakout through a short-term descending channel favors bulls.
- Dips could be seen as a buying opportunity near the $32.65 area.
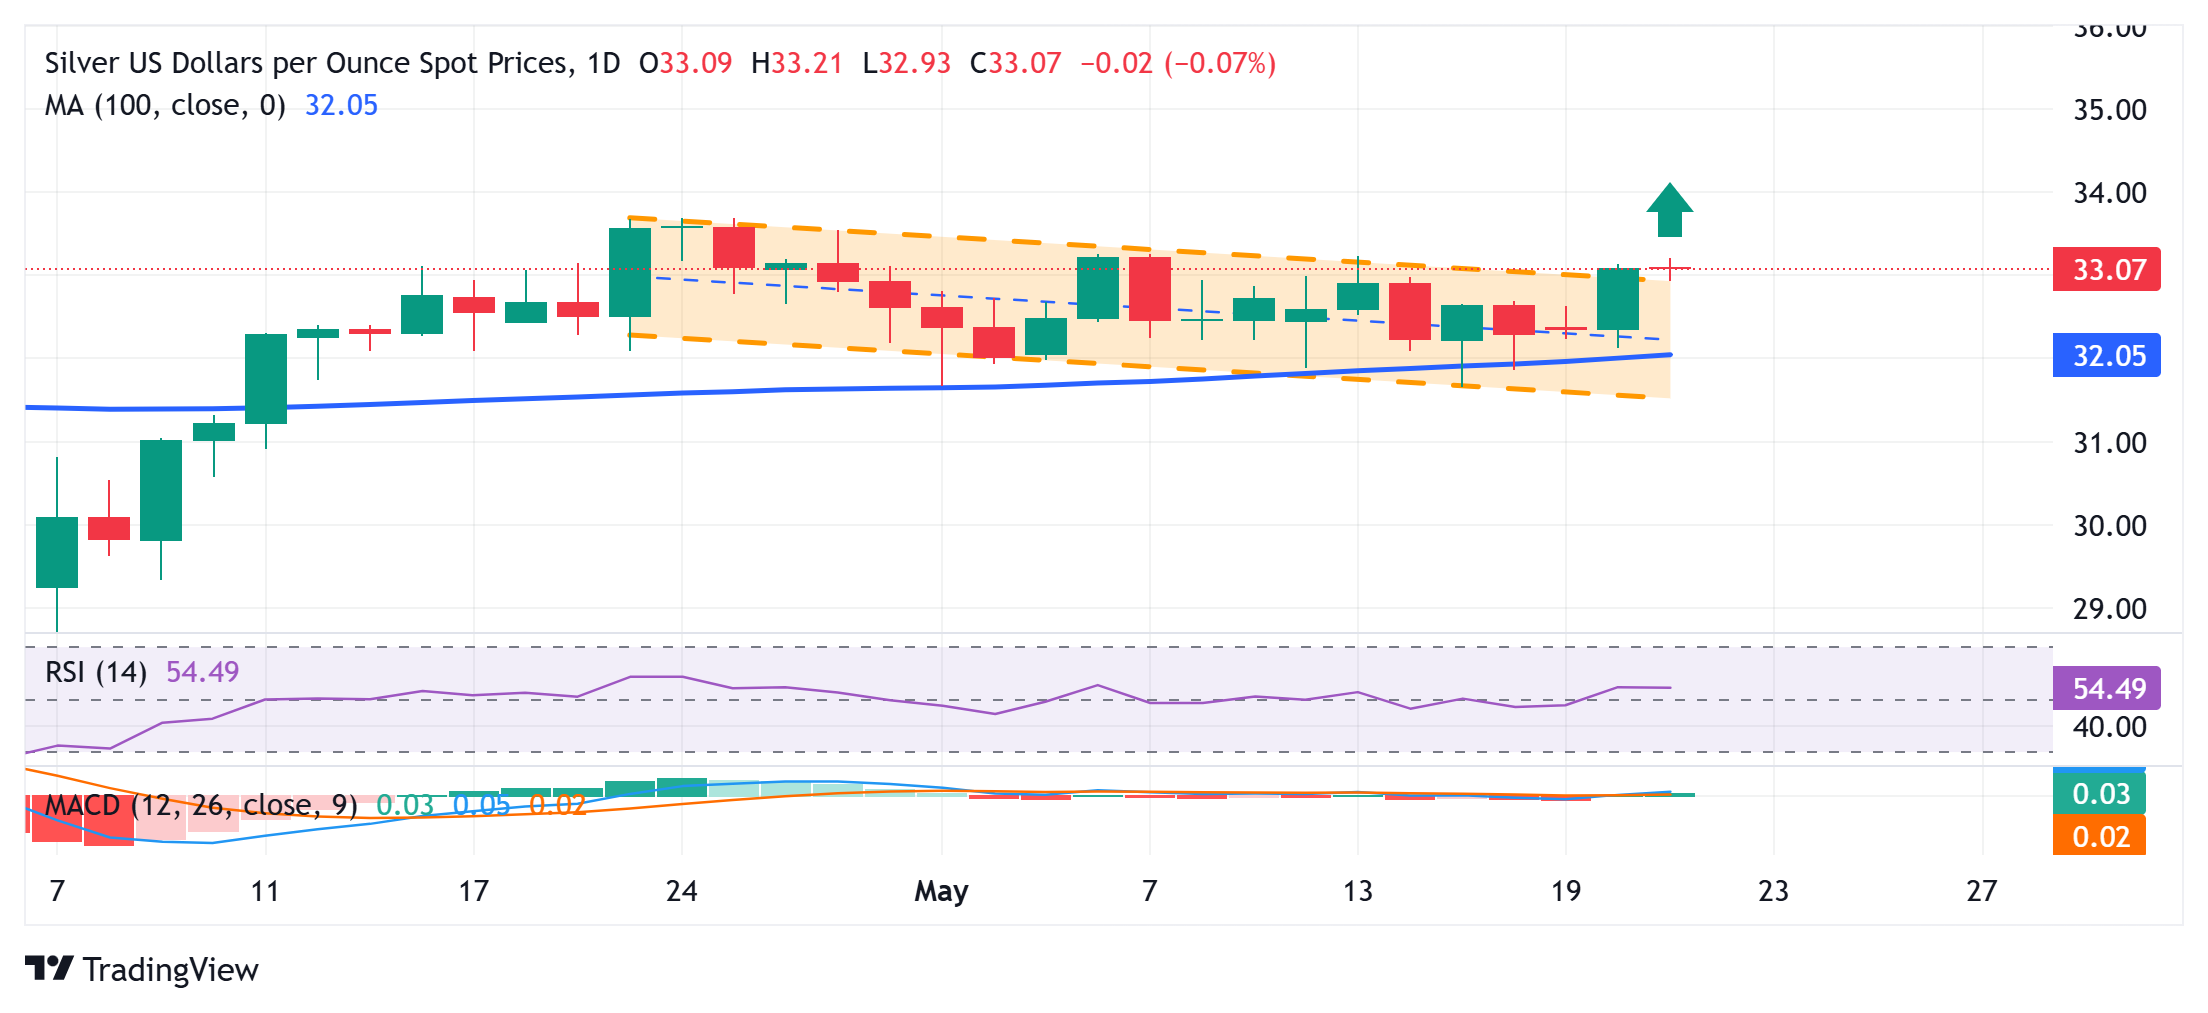
Silver (XAG/USD) retreats slightly following an Asian session uptick to the $33.20 area, or over a one-week high, and erodes a part of the previous day’s strong move up. The white metal currently trades around the $33.00 mark, down 0.30% for the day, though the technical setup favors bullish traders.
Tuesday’s close above the $33.00 mark confirmed a breakout through the top boundary of a multi-week-old descending channel, which constituted the formation of a bullish flag pattern. This comes on top of the recent repeated bounce from the 100-day Simple Moving average (SMA) and validates the constructive setup. Moreover, oscillators on the daily chart have just started moving in positive territory and suggest that the path of least resistance for the XAG/USD is to the upside.
Hence, any subsequent slide might be seen as a buying opportunity and remain limited near the $32.65 horizontal zone. Some follow-through selling, however, would expose the 100-day SMA, currently pegged just above the $32.00 round-figure mark. The subsequent fall could drag the XAG/USD to the descending channel support, around the $31.40 area. A convincing break below the latter will negate the positive outlook and shift the bias in favor of bearish traders.
On the flip side, momentum beyond the Asian session peak, around the $33.20 area, could face some resistance near the $33.60 region, above which the XAG/USD could aim to reclaim the $34.00 round figure mark. The momentum could extend further and eventually lift the white metal to the year-to-date high, around the $34.55-$34.60 zone touched in March.
Silver daily chart