XAG/USD recovers further from multi-week low, climbs above mid-$32.00s
- Silver gains some positive traction and snaps a three-day losing streak to a multi-week low.
- The bearish technical supports prospects for the emergence of some selling at higher levels.
- A sustained move beyond the $34.00 mark is needed to negate the near-term negative bias.
Silver (XAG/USD) builds on the previous day’s goodish bounce from the $31.65 area, or a nearly three-week low, and gains some follow-through traction during the Asian session on Friday. The white metal climbs back above mid-$32.00s in the last hour and for now, seems to have snapped a three-day losing streak, though the technical setup warrants some caution before positioning for any further gains.
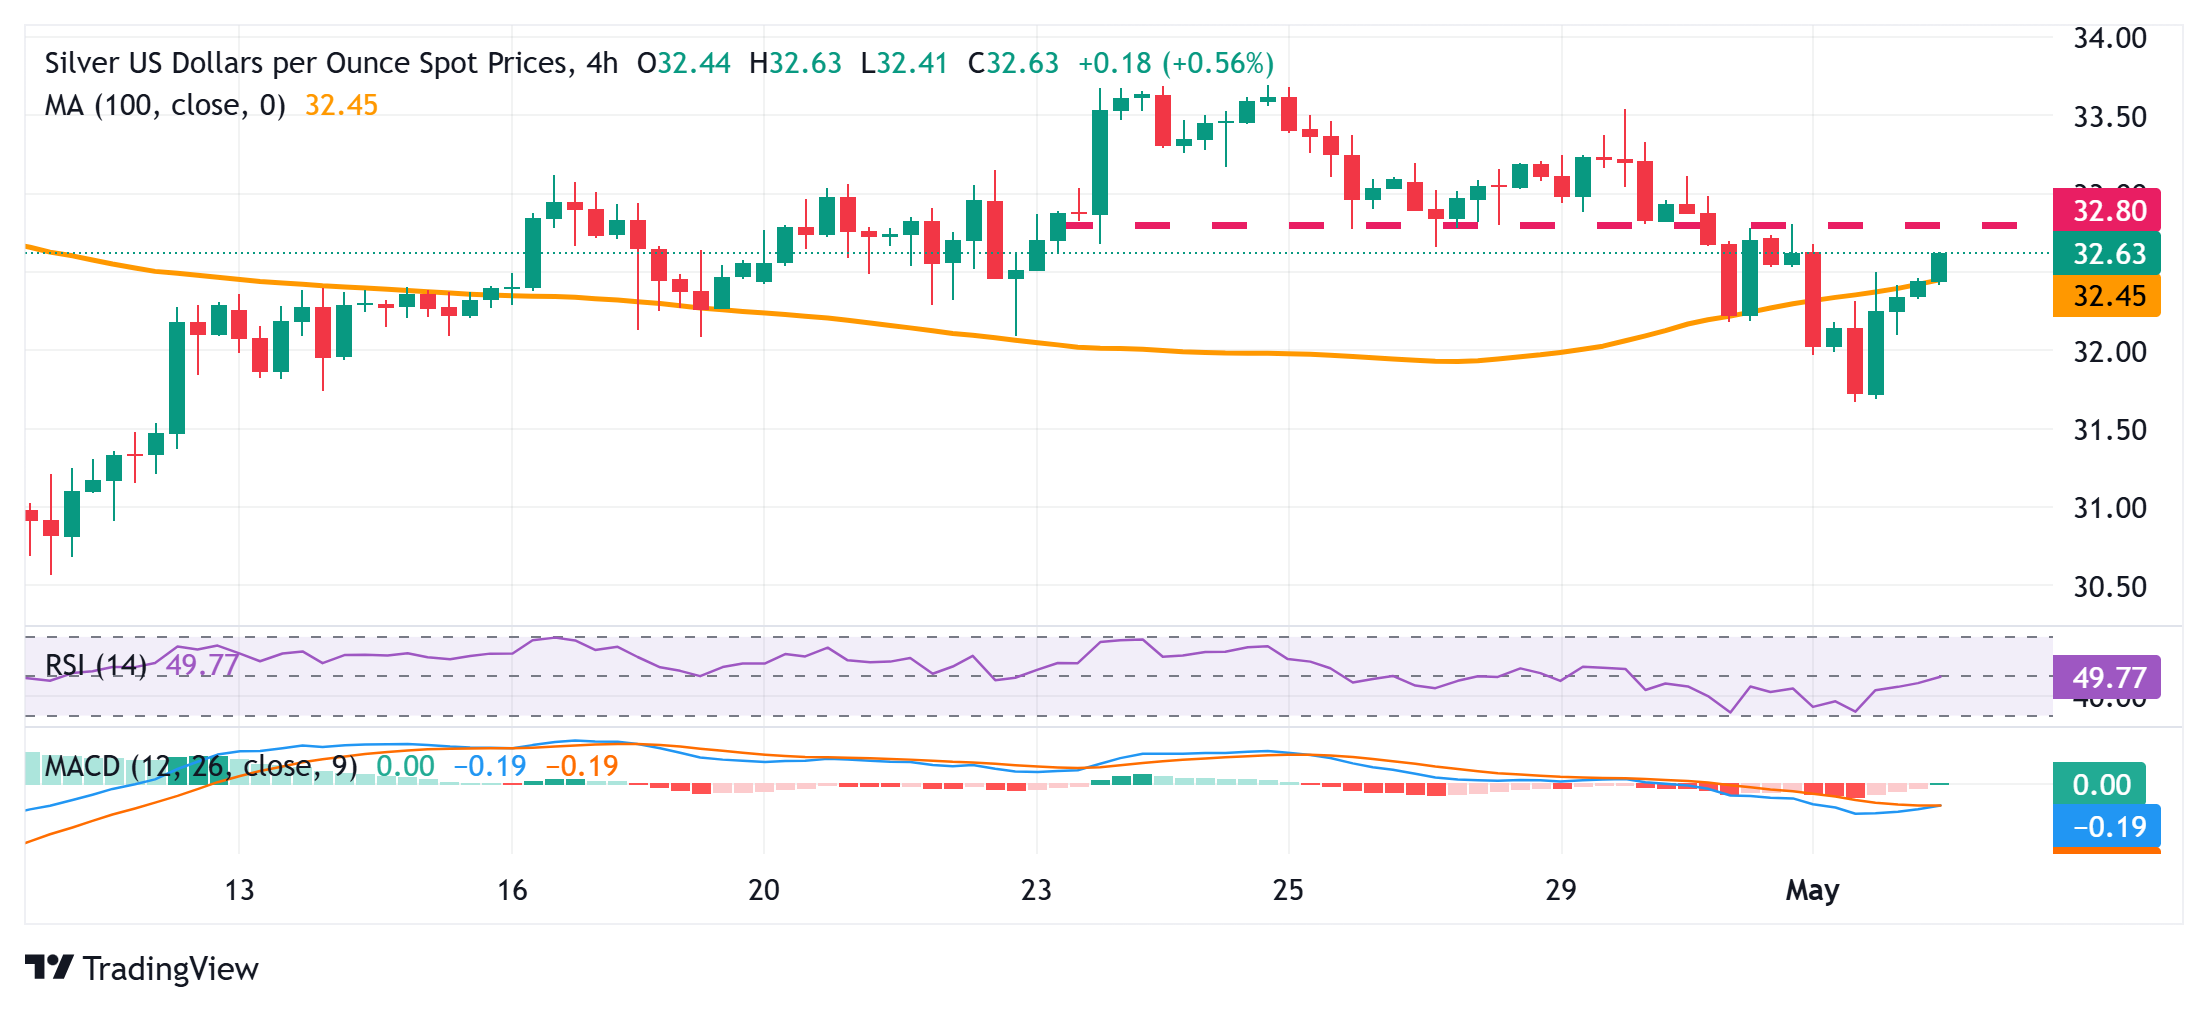
The overnight sustained breakdown below the 100-hour Simple Moving Average (SMA) was seen as a key trigger for bearish traders. Moreover, oscillators on daily/4-hour charts have been gaining negative traction and suggest that the path of least resistance for the XAG/USD is to the downside. Hence, any subsequent move up might still be seen as a selling opportunity and remain capped.
The $32.80 area could now act as an immediate barrier ahead of the $33.00 round-figure mark. Some follow-through buying, however, might trigger a short-covering move and lift the XAG/USD to the $33.70 hurdle. This is followed by the $34.00 round figure, which if cleared decisively would negate the near-term negative outlook and shift the bias in favor of bullish traders.
On the flip side, the $32.25-$32.20 region now seems to offer immediate support ahead of the $32.00 mark. The subsequent downfall could drag the XAG/USD towards the overnight swing low, around the $31.65 region. A convincing break below the latter could drag the white metal to sub-$31.00 levels, or the 200-day SMA, en route to the $30.55-$30.50 intermediate support and eventually to the $30.00 psychological mark.
Silver 4-hour chart