S&P 500 — US Large Cap Index
 FTSE 100 — UK Blue Chips
 Euro Stoxx 50 — Eurozone Leaders
 DAX 40 — German Equities
 CAC 40 — French Market Index
 Nikkei 225 — Japan Benchmark
 Hang Seng — Hong Kong Index
 Shanghai Composite — China Mainland
 ASX 200 — Australian Market
 TSX Composite — Canada Index
 Nifty 50 — India Large Cap
 STI Index — Singapore Market
 KOSPI — South Korea Index
 Bovespa — Brazil Equities
 JSE Top 40 — South Africa Index
 IPC Index — Mexico Market

Australian Dollar holds onto gains against US Dollar, PBoC leaves rates steady


- The Australian Dollar clings to gains near 0.6985 against the US Dollar as the latter underperforms.
- MUFG argues that fading AI-related optimism dampens the US Dollar’s appeal.
- The PBoC keeps one-year and five-year LPRs steady at 3.00% and 3.50%, respectively.
The Australian Dollar (AUD) holds onto two-day gains at around 0.6985 against the US Dollar (USD) during the early European trade on Tuesday. The Aussie pair reflects strength as the US Dollar remains under pressure due to Artificial Intelligence (AI) jitters.
US Dollar Price Last 7 Days
The table below shows the percentage change of US Dollar (USD) against listed major currencies last 7 days. US Dollar was the weakest against the New Zealand Dollar.
| USD | EUR | GBP | JPY | CAD | AUD | NZD | CHF | |
|---|---|---|---|---|---|---|---|---|
| USD | -0.68% | -0.94% | -0.30% | -1.43% | -0.37% | -1.61% | -1.21% | |
| EUR | 0.68% | -0.23% | 0.41% | -0.74% | 0.34% | -0.92% | -0.50% | |
| GBP | 0.94% | 0.23% | 0.65% | -0.49% | 0.58% | -0.69% | -0.21% | |
| JPY | 0.30% | -0.41% | -0.65% | -1.12% | 0.00% | -1.30% | -0.77% | |
| CAD | 1.43% | 0.74% | 0.49% | 1.12% | 1.08% | -0.22% | 0.29% | |
| AUD | 0.37% | -0.34% | -0.58% | 0.00% | -1.08% | -1.26% | -0.79% | |
| NZD | 1.61% | 0.92% | 0.69% | 1.30% | 0.22% | 1.26% | 0.54% | |
| CHF | 1.21% | 0.50% | 0.21% | 0.77% | -0.29% | 0.79% | -0.54% |
The heat map shows percentage changes of major currencies against each other. The base currency is picked from the left column, while the quote currency is picked from the top row. For example, if you pick the US Dollar from the left column and move along the horizontal line to the Japanese Yen, the percentage change displayed in the box will represent USD (base)/JPY (quote).
As of writing, the US Dollar Index (DXY), which gauges the Greenback’s value against six major currencies, trades 0.2% lower to near 101.77.
Market experts have argued that the US Dollar has become more responsive to the AI narrative, citing strong foreign inflows for AI-related stocks. Therefore, a recent correction in the sector diminished the appeal of the US Dollar.
Dollar increasingly driven by AI-fuelled inflows, raising reversal risks
Analysts at MUFG highlight that US financial markets have been “a major beneficiary of strong foreign investor demand driven by AI-related optimism.” They note that foreign investors purchased “USD942 billion of US equities in the twelve months to July, while purchases of US corporate bonds increased sharply to USD452 billion over the same period.” MUFG argues that these “sizeable inflows highlight how the USD has become increasingly tied to investors’ search for higher returns in US financial markets, rather than benefiting from its traditional safe-haven status.” However, they caution that “this dynamic also leaves the USD more exposed to a reversal if sentiment towards AI deteriorates.”
Contrary to MUFG, strategists at Brown Brothers Harriman (BBH) have pushed back against the notion that the recent “synchronized correction in technology stocks and USD” leaves the Dollar structurally exposed to an AI-driven equity sell-off.
BBH acknowledges that some investors fear the Dollar could be vulnerable as foreign holders unwind US stock positions, but argue instead that “an AI/tech unwind would simply encourage foreign investors to rotate back into safe-haven Treasuries, underpinning the dollar’s defensive appeal.” In their view, any de-risking in AI-related equities is more likely to reinforce, rather than undermine, the Dollar’s status as a haven supported by foreign demand for US government bonds.
Though the Australian Dollar fares well against the US Dollar, the former is underperforming other peers after the People’s Bank of China (PBoC) leaves its one-year and five-year Loan Prime Rates (LPRs) unchanged at 3.00% and 3.50%, respectively.
The Australian currency impacted meaningfully from PBoC’s policy decision, given that the Australian economy relies heavily on its exports to China.
AUD/USD Technical Analysis
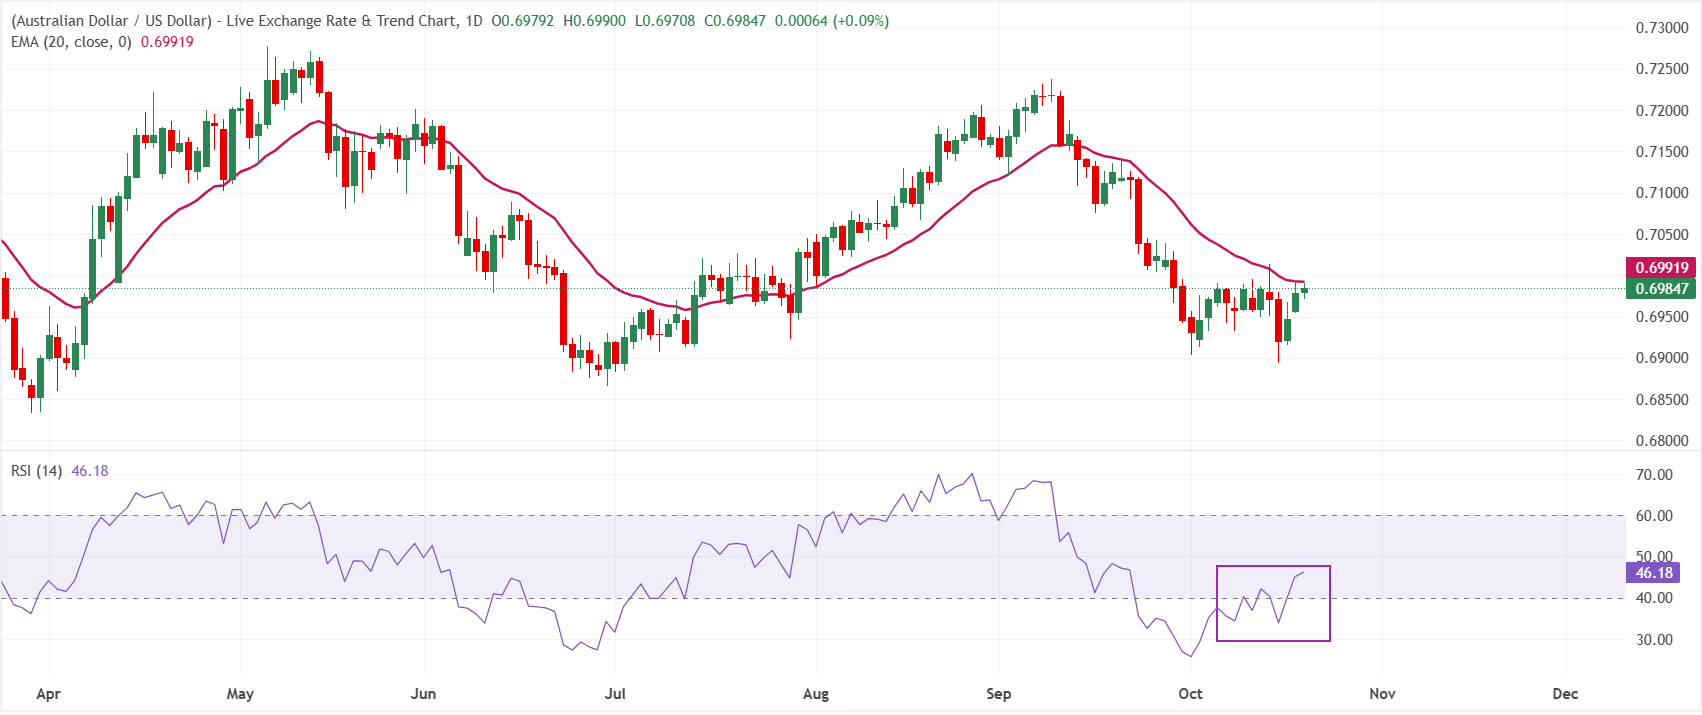
In the daily chart, AUD/USD trades at 0.6984, keeping a bearish near-term tone as spot holds just beneath the 20-day exponential moving average (EMA) at 0.6992. The pair’s inability to reclaim this short-term EMA suggests upside attempts remain capped, while the Relative Strength Index (RSI) around 46 stays in neutral territory, hinting at a modest but not yet oversold downside bias.
On the topside, immediate resistance is defined by the 20-day EMA at 0.6992, which acts as the first hurdle for any recovery extension. A sustained break above this level would ease current selling pressure and open the way for a more constructive phase, whereas failure to overcome 0.6992 leaves the pair vulnerable to further slippage toward lower daily lows not yet defined by nearby structural support in the current dataset.