S&P 500 — US Large Cap Index
 FTSE 100 — UK Blue Chips
 Euro Stoxx 50 — Eurozone Leaders
 DAX 40 — German Equities
 CAC 40 — French Market Index
 Nikkei 225 — Japan Benchmark
 Hang Seng — Hong Kong Index
 Shanghai Composite — China Mainland
 ASX 200 — Australian Market
 TSX Composite — Canada Index
 Nifty 50 — India Large Cap
 STI Index — Singapore Market
 KOSPI — South Korea Index
 Bovespa — Brazil Equities
 JSE Top 40 — South Africa Index
 IPC Index — Mexico Market

The EURNOK exchange rate has risen by over 5% over the past month, returning to levels last observed in the first half of February, prior to the outbreak of the war in Iran. The key factor behind the weakening of the krone is the decline in crude oil prices (-35% compared to the May peak).
Crude Oil
A barrel of Brent crude currently costs just over $72. The price of WTI is hovering around $70. There appears to be limited scope for further falls, as indicated by the futures curve, which has flattened out considerably in recent times. Figure 1: Futures Curve for WTI Crude Oil (2026 – 2037)
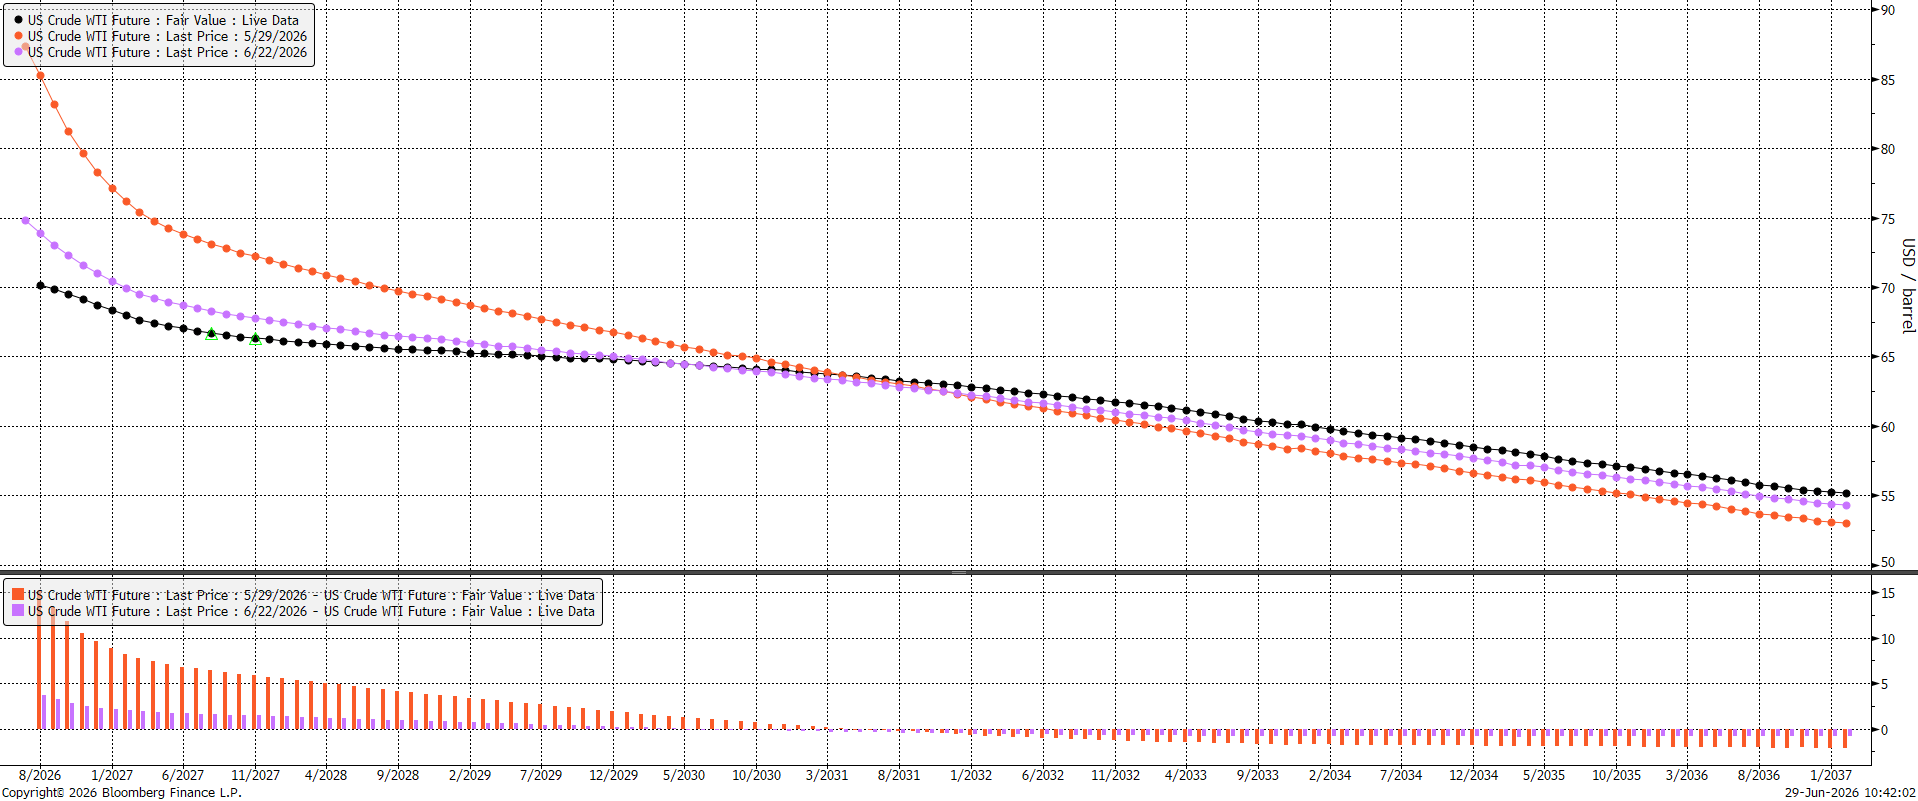
Source: Bloomberg, 29.06.2026 The price of a barrel of WTI crude oil is currently below the 5-year average (which was inflated by the energy shock caused by Russia’s attack on Ukraine). Figure 2: Seasonality of WTI Crude Oil Prices (2021 – 2026)
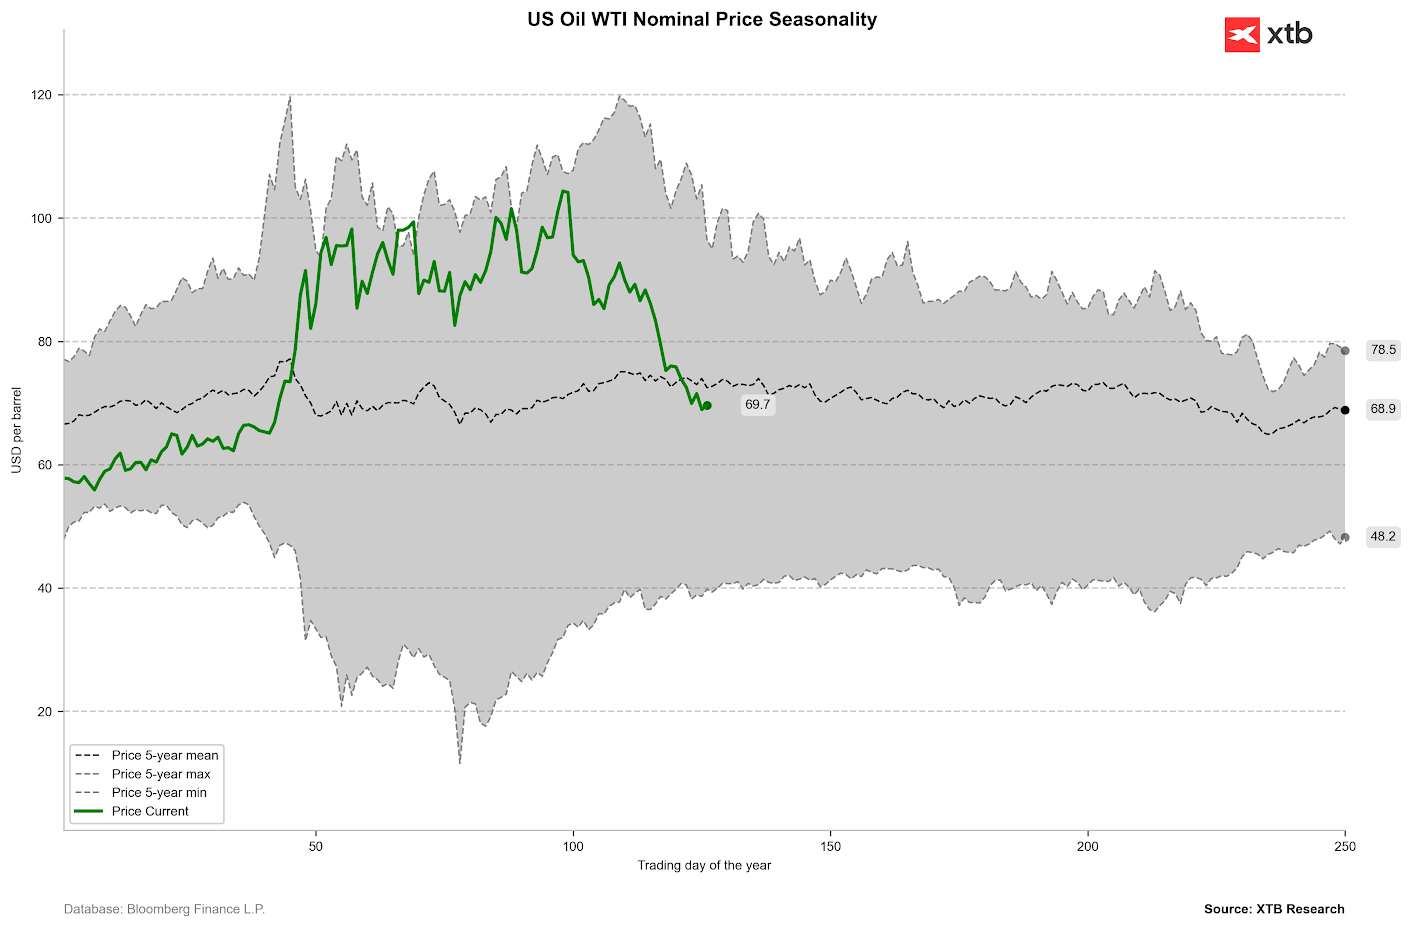
Source: XTB Research, 29.06.2026
Geopolitics
The events of last weekend represent one of the most serious tests for the US-Iranian memorandum signed in June. The renewed rise in tensions was triggered by an attack by Iranian forces on the Singapore-flagged container ship M/V Ever Lonely. Donald Trump called this incident a “stupid violation” of the ceasefire negotiated a week earlier and announced that America would not leave it unanswered. This resulted in targeted air strikes on targets in southern Iran (including the area of the port of Sirik and Qeshm Island).
Missile depots, drone hangars, and radar-surveillance infrastructure were destroyed. In response to the US air strikes, on the night from Saturday to Sunday, the Islamic Revolutionary Guard Corps carried out a massive missile and drone bombardment aimed at military bases in the Persian Gulf countries: Kuwait and Bahrain. The Bahraini Ministry of Interior reported that one of the missiles or its shrapnel damaged a residential building near the international airport. Tehran officially threatened that further military actions from the USA would lead to a “complete freezing of all diplomatic processes.” In turn, Donald Trump warned on the X platform that if Iran does not start complying with the arrangements, the USA will “militarily finish the job.” Despite the dramatic exchange of blows and aggressive rhetoric, a sudden turn of events occurred on Sunday evening. Under pressure from international mediators (Qatar and Pakistan), both sides decided to de-escalate. As Reuters reported, citing senior US officials, Washington and Tehran agreed to immediately halt mutual strikes and restore free commercial shipping in the strait to save the previously developed framework agreement.
Negotiations are set to resume as early as Tuesday (30 June) in Doha. The main point of contention remains the issue of control over the Strait of Hormuz. The US and the UN are trying to establish new, independent maritime corridors for commercial vessels, to which Iran refuses to agree, claiming that it violates its sovereignty and right of oversight. A renewed escalation of the conflict, which would stand in the way of fully clearing traffic in the Strait of Hormuz, poses a key risk to the path of crude oil prices outlined by the futures curve.
Monetary Policy
The weakening of the krone has also been supported in recent days by a repricing of the interest rate path. Expectations for interest rate hikes by Norges Bank in the fourth quarter of the year have fallen. Markets seem to place less and less faith in two upward moves before the end of the year, which can be linked primarily to a decrease in concerns about a long-term energy crisis. Figure 3: Market Pricing of Norges Bank Interest Rate Path (2026)
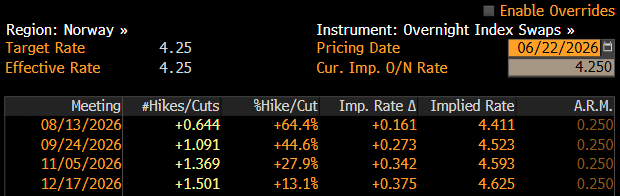
Source: Bloomberg, 22.06.2026 Figure 4: Market Pricing of Norges Bank Interest Rate Path (2026)
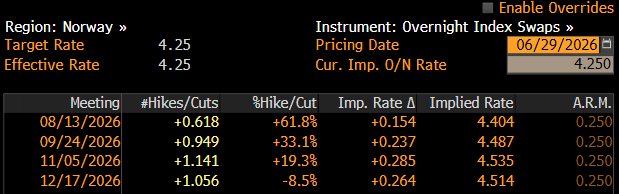
Source: Bloomberg, 29.06.2026 The next bank meeting is not until 13 August.
Macroeconomic Data
Before the next Norges Bank decision, two inflation readings await us. We pay attention primarily to the still very high core measure (3.4%), whose strong momentum (around 5% on a three-month annualised basis) suggests that higher energy prices are spilling over into the rest of the economy. Price pressure was supported by elevated wage growth. Recently, however, it has begun to slow down quite clearly, especially in real terms. In the first quarter, it reached 4.4% in the industrial sector, which means an increase of just over 1% after accounting for the decline in purchasing power. This is reflected in the consumption data. Retail sales in May showed negative dynamics for the first time in a year (-2.5%). Consumer confidence is also deteriorating.
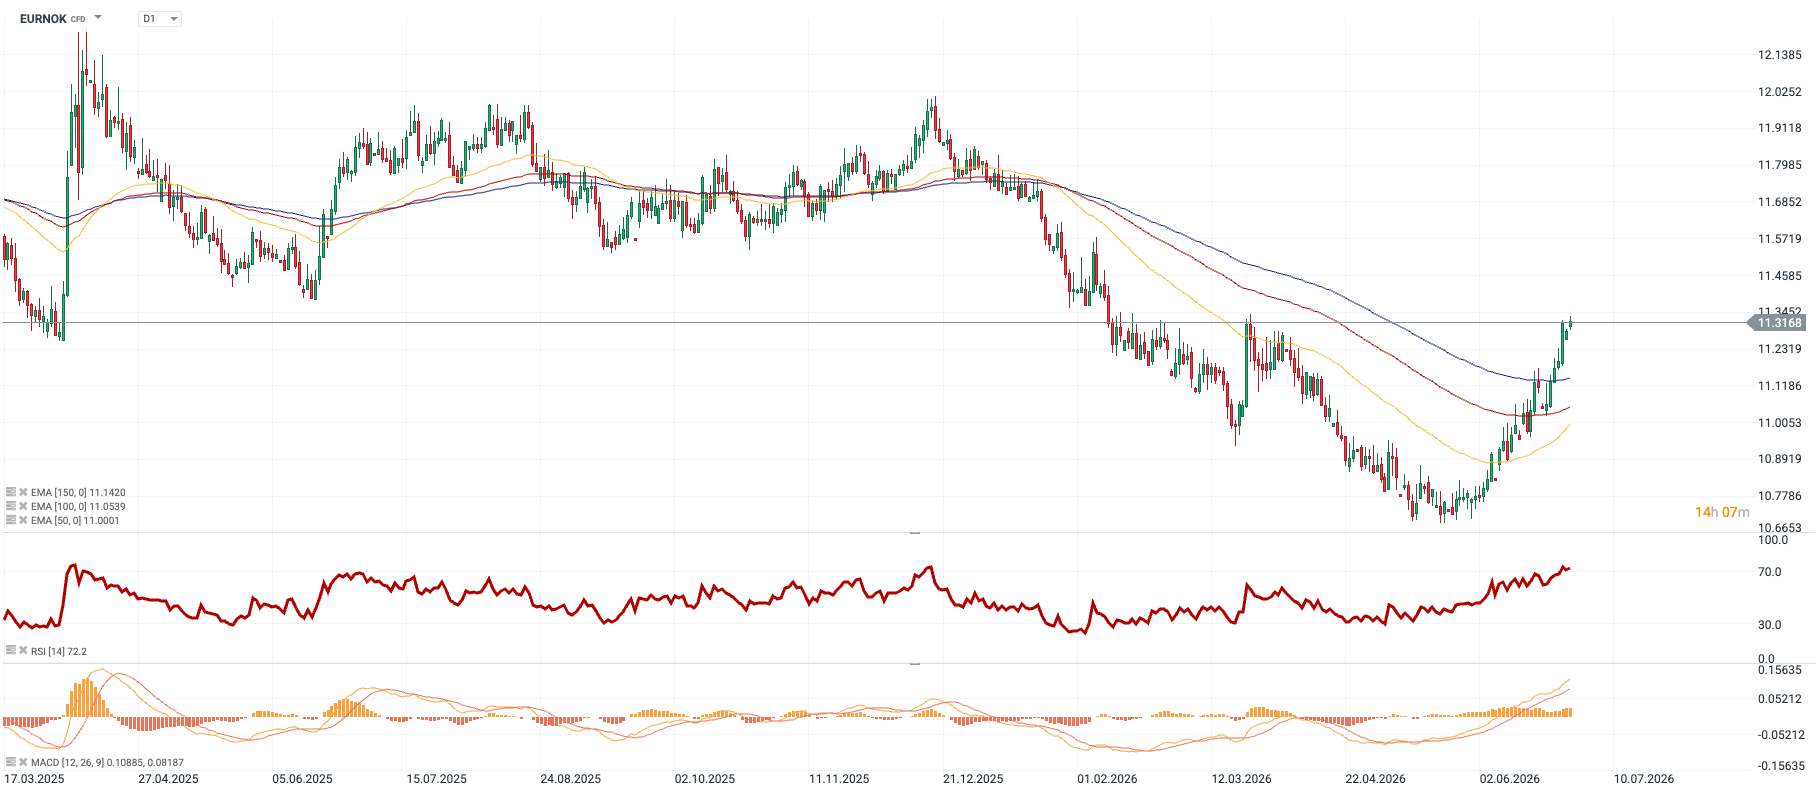
Technical Analysis Figure 5: EURNOK (17.03.2025 – 29.06.2026)
Source: xStation, 29.06.2026
The current turnaround on the EURNOK pair is strong enough that the price has managed to break through the 50, 100, and 150 EMA moving averages. The strength of the current upward momentum is confirmed by the MACD indicator – the histogram is rising and the lines are above zero and directed upwards. Caution is suggested, however, by the RSI indicator (72.2) – it has already entered the overbought zone, which heralds the risk of a local correction or consolidation.