S&P 500 — US Large Cap Index
 FTSE 100 — UK Blue Chips
 Euro Stoxx 50 — Eurozone Leaders
 DAX 40 — German Equities
 CAC 40 — French Market Index
 Nikkei 225 — Japan Benchmark
 Hang Seng — Hong Kong Index
 Shanghai Composite — China Mainland
 ASX 200 — Australian Market
 TSX Composite — Canada Index
 Nifty 50 — India Large Cap
 STI Index — Singapore Market
 KOSPI — South Korea Index
 Bovespa — Brazil Equities
 JSE Top 40 — South Africa Index
 IPC Index — Mexico Market
Chart of the day – Gold rebounds 1.3% despite hawkish Fed stance

Gold is rebounding by more than 1.3% after the decline triggered by the Fed’s first rate hike in more than three years. Higher interest rates are usually negative for gold, which does not generate yield, but the market had already priced in the Fed move to some extent, so the reaction has remained relatively limited.
- The next direction for gold will depend primarily on how many additional Fed rate hikes the market begins to price in.
- Donald Trump publicly commented on the decision, saying that U.S. interest rates should fall to 1% and that the Fed should cut them immediately.
- The base-case scenario assumes one more rate hike this year, possibly in December, followed by a longer pause in the tightening cycle.
- However, falling oil prices could become the key factor. If crude continues to move lower, markets may quickly revise their expectations for future Fed policy.
GOLD chart (H1, D1 timeframe)
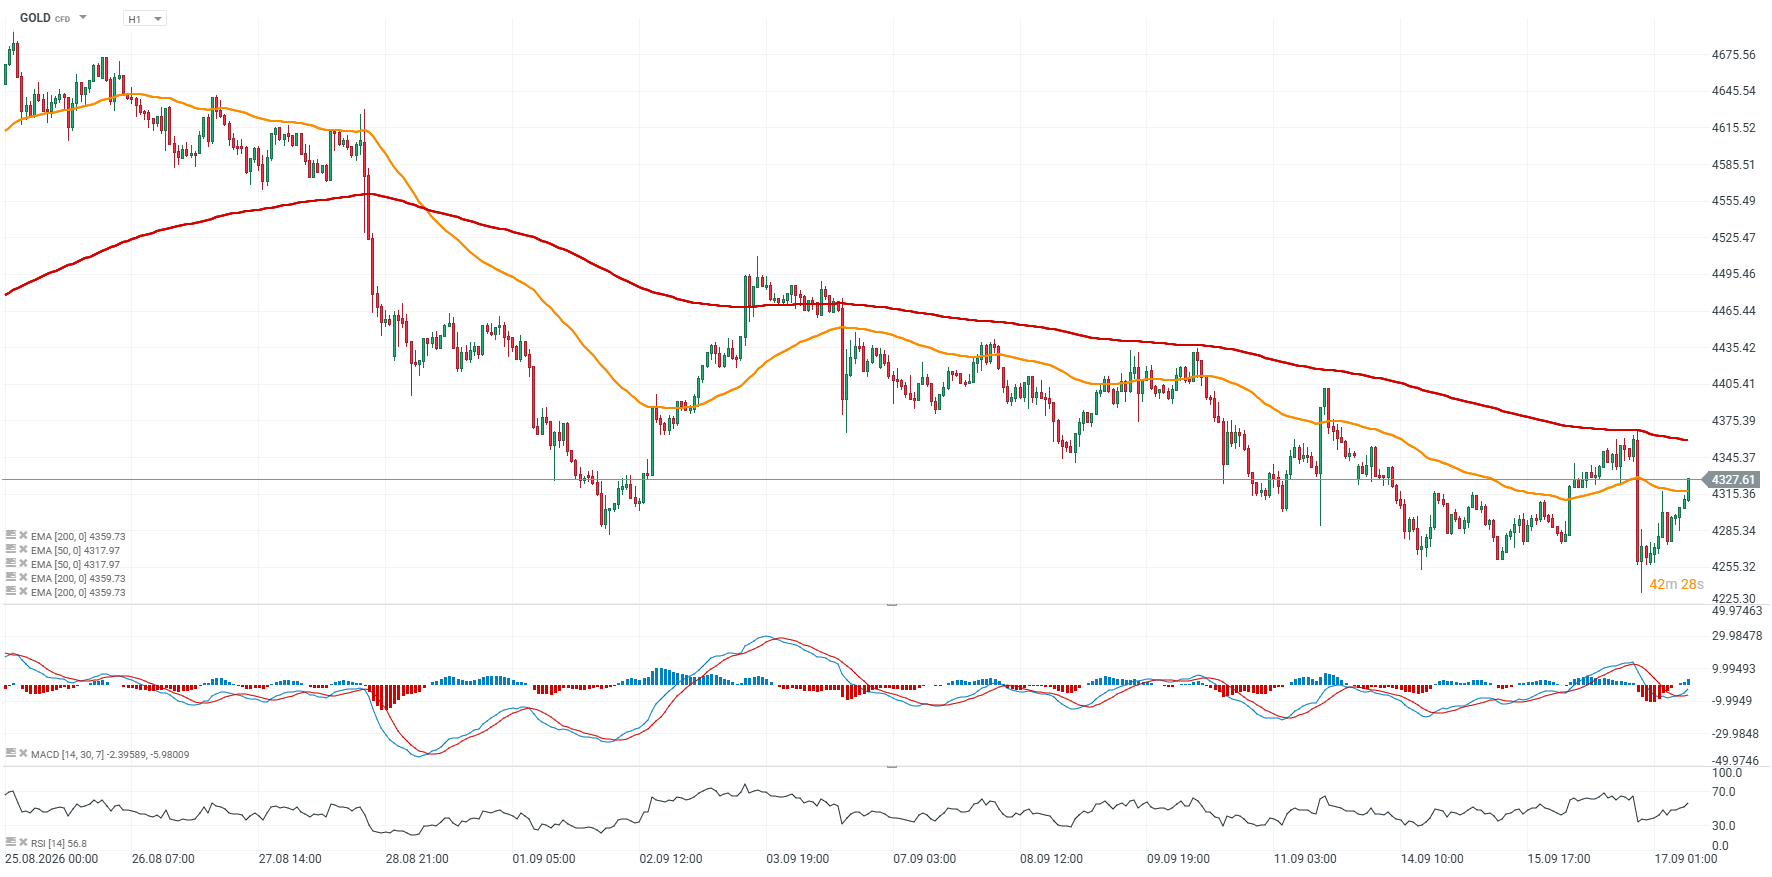
Looking at gold, the price has managed to move back above the 50-period exponential moving average, EMA50 (orange line), but the key hurdle remains the 200-period EMA200, which has capped the market since the beginning of September. This makes the $4,370 per ounce area the key short-term resistance level, while support remains around $4,250.
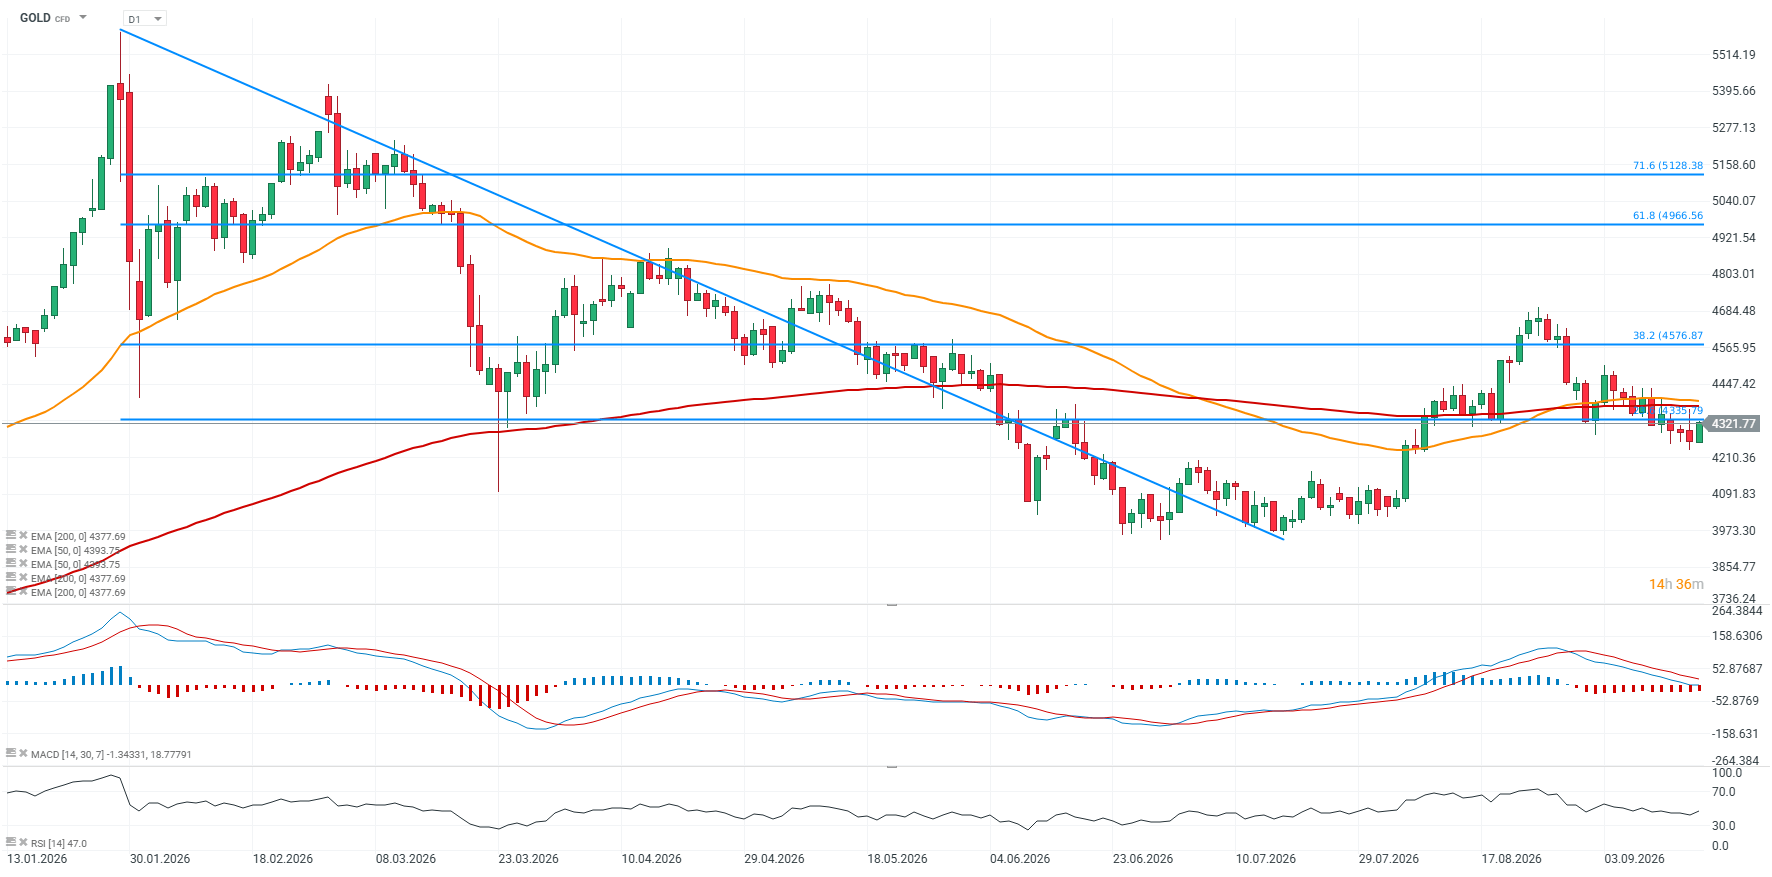
Source: xStation5 The importance of the $4,370 per ounce area is also confirmed by the 200-period EMA200 (red line) on the daily chart, with the 50-period moving average also converging nearby. The RSI remains close to neutral levels, and although gold has pulled back from around $4,600, it is still up roughly 10% from this year’s low below $4,000 per ounce. A break above $4,370 could open the way toward the recent local highs near $4,575 per ounce, where the 38.2% Fibonacci retracement of the winter 2026 downward impulse is located.
Source: xStation5