S&P 500 — US Large Cap Index
 FTSE 100 — UK Blue Chips
 Euro Stoxx 50 — Eurozone Leaders
 DAX 40 — German Equities
 CAC 40 — French Market Index
 Nikkei 225 — Japan Benchmark
 Hang Seng — Hong Kong Index
 Shanghai Composite — China Mainland
 ASX 200 — Australian Market
 TSX Composite — Canada Index
 Nifty 50 — India Large Cap
 STI Index — Singapore Market
 KOSPI — South Korea Index
 Bovespa — Brazil Equities
 JSE Top 40 — South Africa Index
 IPC Index — Mexico Market

Key takeaways
- Nikkei 225 futures rose 1.83 percent driven by strong semiconductor stocks following Micron earnings.
- European and US indices declined as rising oil prices and interest rate pressures weighed on markets.
- The Bank of Japan faces less pressure for urgent rate hikes due to the latest Tankan business sentiment survey.
- Nikkei 225 trades near 68 269 points, sitting between key Fibonacci retracement levels of 67 168 and 68 731.
- Buyers maintain control while the index holds above 67 168, though a close above 68 731 is needed to confirm strength.
Today’s session looks very intriguing, although even before the European open it seemed that all indices would play the same tune. Nikkei 225 futures are up 1.83% and are the second strongest instrument among all indices, behind only the European volatility index VSTOXX. At the same time, almost all of Europe is in the red: WIG20 is down 2.01%, IBEX 1.84%, FTSE 100 1.71%, AEX 1.51%, DAX 0.98%. US index futures are giving back earlier gains, with the S&P 500 down slightly and the Dow Jones down 0.56%.
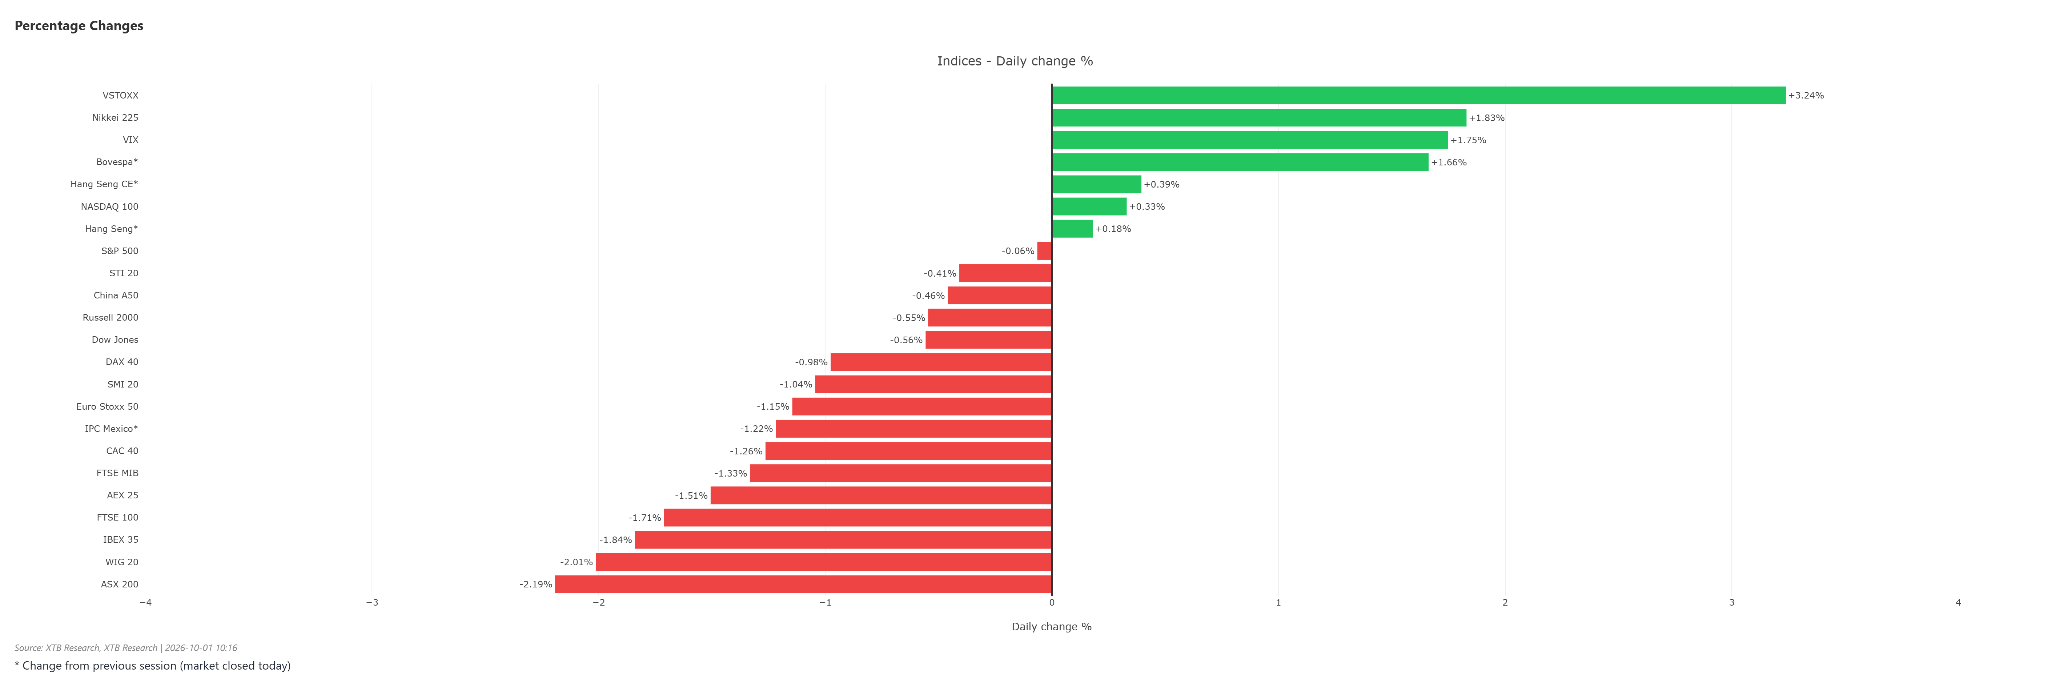
Why is Japan rising while the rest is falling?
This is composed of three separate stories that happened to coincide in time. Semiconductors are pulling the Nikkei up. This is the main driver of today’s movement. The Japanese index has a structurally different composition than European benchmarks. Under price-weighting, a few high-value tech stocks account for a disproportionately large share of the index’s move. Advantest, Tokyo Electron, SoftBank Group, and Screen Holdings can single-handedly generate most of the Nikkei’s daily movement. When the semiconductor cycle receives a positive impulse (yesterday’s Micron earnings), the Japanese index responds much more strongly than the DAX or CAC 40, which practically lack this tech sector. Tankan took the pressure off the Bank of Japan. The quarterly business sentiment survey release weakens the arguments for an urgent rate hike. For the Japanese stock market, this is a directly favorable setup: a weaker yen improves exporters’ results, while postponing tightening removes pressure from valuations. This is the exact opposite of what Europe is experiencing, where the ECB returned to rate hikes in September. For October, an 18% probability of a hike is priced in, while December is fully priced in. Europe and the US are paying the bill for oil. Article headlines in today’s press explicitly attribute the declines to a renewed rebound in oil prices. December Brent is rising close to 100 USD, and WTI is already above 92 USD. Japan imports virtually all of its energy, so theoretically it should suffer the most, but today the sectoral boost from tech prevailed.
Valuations: things are getting uncomfortable
The long-term Z-score chart requires attention, as it puts today’s move into a broader perspective.
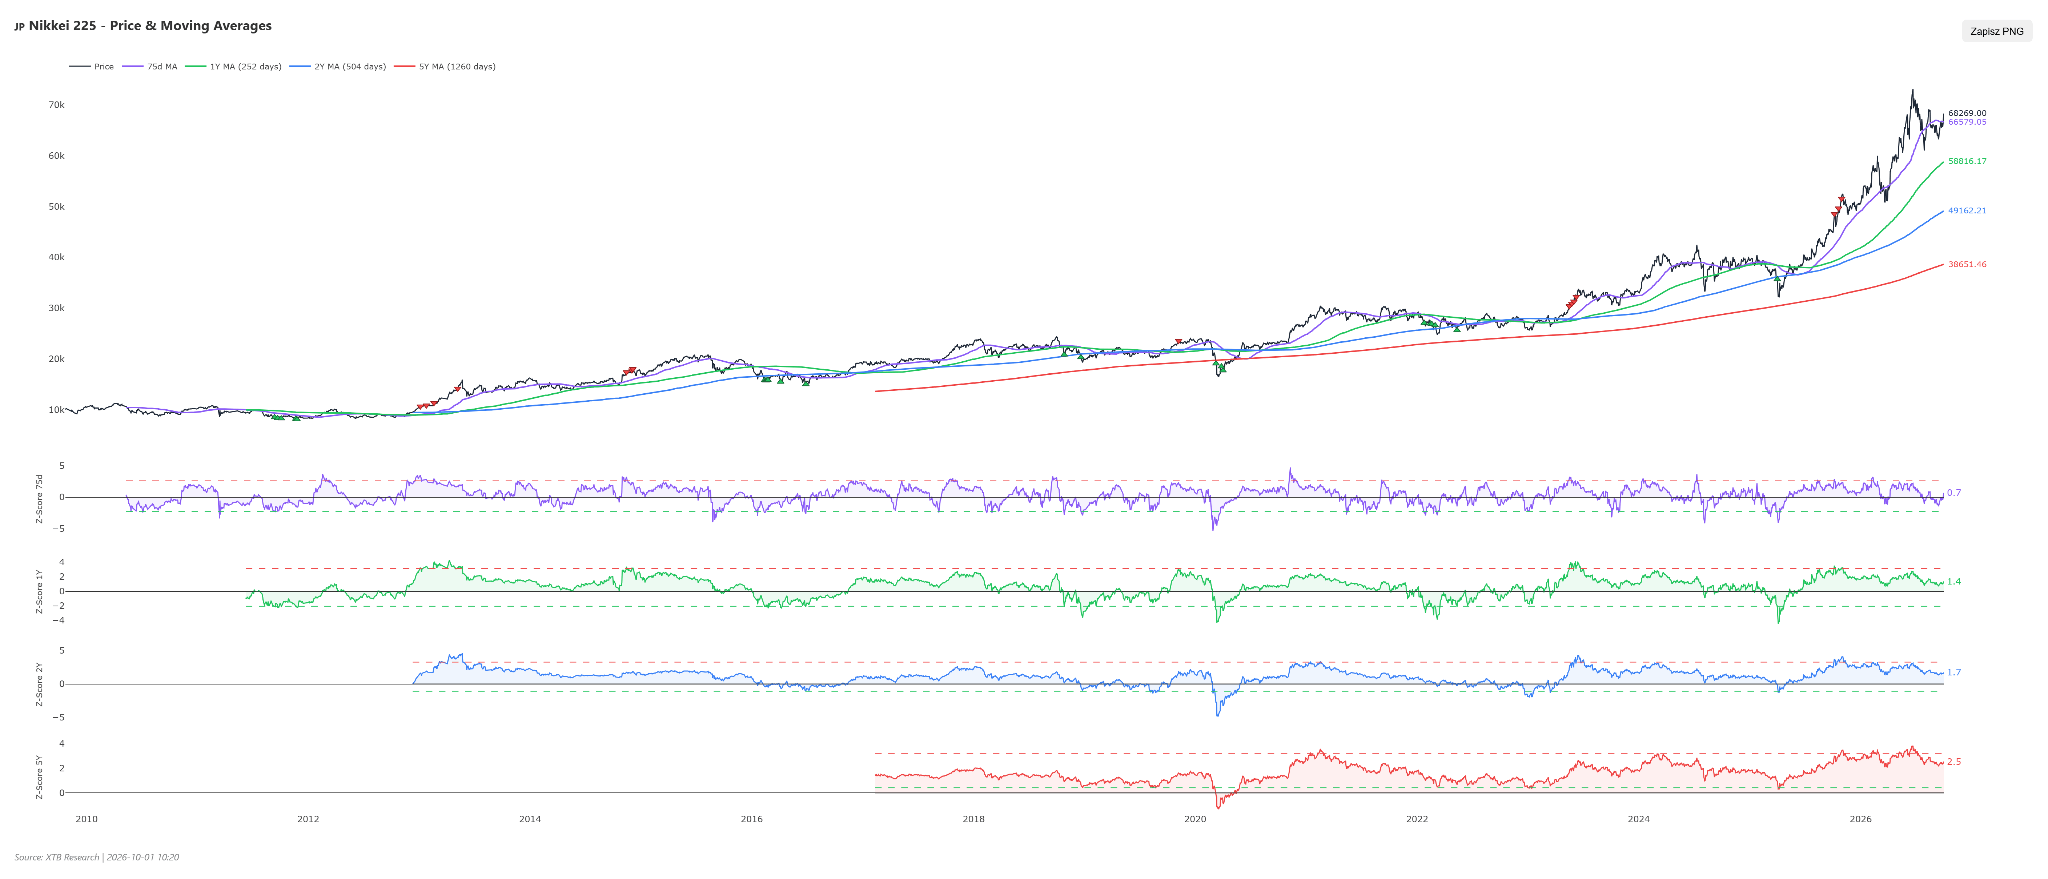
With the Nikkei at 68,269 points, it stands 2.5 standard deviations above its five-year moving average of 38,651. The two-year Z-score is 1.7, the one-year is 1.4, and the 75-day is 0.7. The gap between the price and the 5-year moving average is currently around 76%, a degree of stretch unseen in the market’s recent history. This is not a sell signal. The Z-score speaks to position relative to history, not direction. However, it implies that any prospective correction has much more room to fall than a short-term chart would suggest, and current levels offer no safety buffer. Significantly, the 75-day Z-score at 0.7 shows that the index is not overbought in the short term. The issue is structural, not tactical.
Technical analysis of JP225 on the daily timeframe
The JP225 daily chart shows a clear structure following the July peak. The market reached a high of 73,791 in early July before dropping to 60,545 in the first half of August. The current Fibonacci retracement is plotted over this swing, defining all key levels. After the August trough, a bounce ensued toward the 70,956 area, the 78.6% retracement, where supply took over. A September leg down brought the index back to around 62,500, from which the market has been building another rebound, reaching 68,284 today. The current location is key. Price sits right between the 50% retracement at 67,168 and the 61.8% at 68,731. These 500 points above the current price present the first real resistance hurdle.
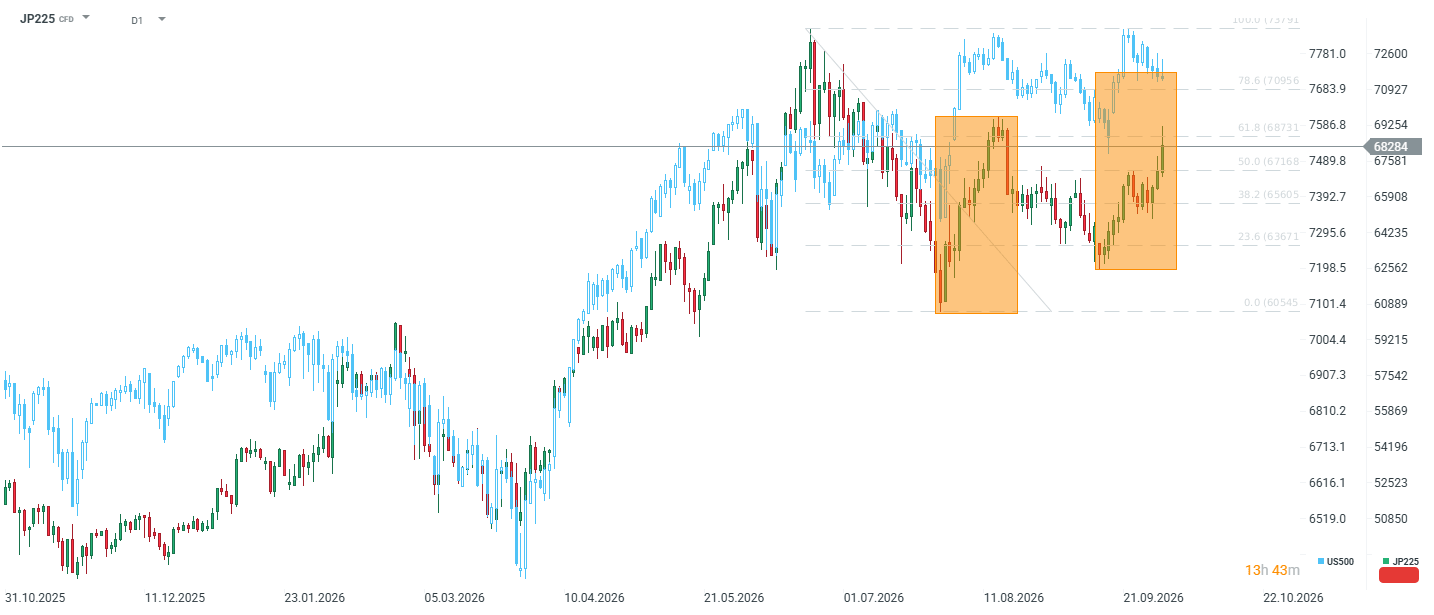
Base scenario. As long as price holds above 67,168, buyers retain the initiative, and the higher-low structure since August remains intact. The market has made two attempts at the 68,500 to 69,000 zone, both rejected, making this third test of the area a decisive moment. What to watch? Today’s rally is narrow sectorally and accompanied by rising volatility in other markets. Such a combination often precedes a reversal. Confirmation of strength would be a close above 68,731 alongside a calming of the VIX and VSTOXX. If volatility indices keep rising while the Nikkei fails to sustain current levels, we have a classic bull trap breakout and a move back toward 65,600.