S&P 500 — US Large Cap Index
 FTSE 100 — UK Blue Chips
 Euro Stoxx 50 — Eurozone Leaders
 DAX 40 — German Equities
 CAC 40 — French Market Index
 Nikkei 225 — Japan Benchmark
 Hang Seng — Hong Kong Index
 Shanghai Composite — China Mainland
 ASX 200 — Australian Market
 TSX Composite — Canada Index
 Nifty 50 — India Large Cap
 STI Index — Singapore Market
 KOSPI — South Korea Index
 Bovespa — Brazil Equities
 JSE Top 40 — South Africa Index
 IPC Index — Mexico Market
CME Group – Market Volatility and Geo-Political Uncertainty See Volume Peak

CME Group shares (CME.US) remain one of the key beneficiaries of elevated market volatility in 2026, which directly translates into higher trading volumes and transaction revenues. The Chicago-based exchange operator is leveraging a backdrop of macroeconomic and geopolitical uncertainty to generate above-average operating results. At the same time, early signs are emerging that growth dynamics may be reaching a local peak, which is beginning to be priced in by part of the market.
- CME reported record volumes average daily volume (ADV) in March reached 41.1 million contracts (+33% YoY), while the full first quarter averaged 36.2 million (+22% YoY), confirming strong demand for risk-hedging instruments.
- Activity increased across all major segments, including interest rate, commodities, and U.S. Treasury contracts, where open interest reached record levels.
- UBS raised its Q1 2026 EPS forecast to $3.38 (vs. $3.29 previously and $3.16 consensus), pointing to higher transaction revenues driven by rising volumes.
- At the same time, UBS maintains a Neutral rating and a $310 price target (around current levels), suggesting limited upside at current valuations.
- The bank notes that although volumes remain high, pricing pressure (including discount structures and product mix) is partly limiting revenue growth.
- UBS believes the current environment is supportive for results, but peak activity may already be behind us, implying tougher comparisons in the coming quarters.
- As a result, UBS prefers companies less dependent on volume-driven dynamics, which underpins its cautious stance on CME.
- Despite this, CME remains a strong momentum stock – shares are up approximately 14% YTD, despite the S&P 500 falling over 10% and nearly 20% in the past six months.
- Meanwhile, Raymond James maintains a more positive stance (Outperform), citing weakness in the competing FMX platform as a supportive factor for CME.
- Operational incidents remain a negative factor, including the temporary suspension of trading in metals and gas markets, which the company is still analyzing.
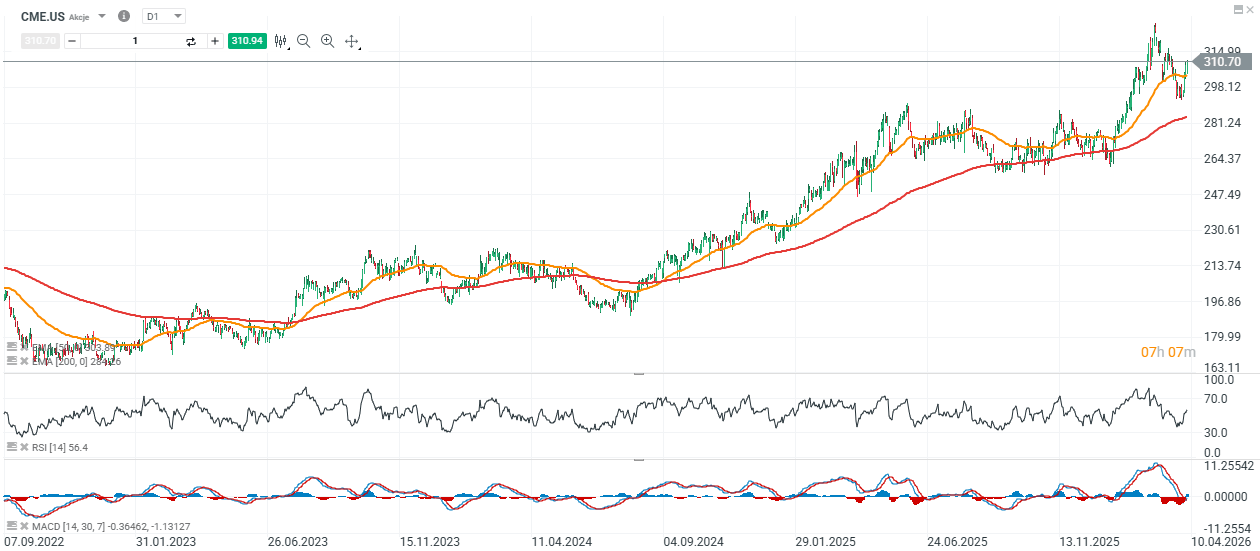
CME Group shares (CME.US, D1 interval)
CME Group remains a high-quality beneficiary of market volatility, although according to UBS, further upside potential is limited as favorable operating conditions have largely been priced in. The company benefits from record trading volumes in U.S. Treasuries, aggressive hedging activity in the S&P 500, and business diversification, while maintaining a near-monopolistic position across several large markets. Investors view it as a defensive stock with a high-quality business, strong management, and a strategy that effectively capitalizes on market uncertainty. From a technical perspective, the uptrend appears intact, although the stock may face short-term resistance — particularly around the $315–320 range. Key support currently stands near $280, where the 200-day EMA (red line) is located.
Source: xStation5
The material on this page does not constitute financial advice and does not take into account your level of understanding, investment objectives, financial situation or any other specific needs. All information provided, including opinions, market research, mathematical results and technical analyzes published on the Website or transmitted To you by other means, it is provided for information purposes only and should in no way be construed as an offer or solicitation for a transaction in any financial instrument, nor should the information provided be construed as advice of a legal or financial nature on which any investment decisions you make should be based exclusively To your level of understanding, investment objectives, financial situation, or other specific needs, any decision to act on the information published on the Website or sent to you by other means is entirely at your own risk if you In doubt or unsure about your understanding of a particular product, instrument, service or transaction, you should seek professional or legal advice before trading. Investing in CFDs carries a high level of risk, as they are leveraged products and have small movements Often the market can result in much larger movements in the value of your investment, and this can work against you or in your favor. Please ensure you fully understand the risks involved, taking into account investments objectives and level of experience, before trading and, if necessary, seek independent advice.