S&P 500 — US Large Cap Index
 FTSE 100 — UK Blue Chips
 Euro Stoxx 50 — Eurozone Leaders
 DAX 40 — German Equities
 CAC 40 — French Market Index
 Nikkei 225 — Japan Benchmark
 Hang Seng — Hong Kong Index
 Shanghai Composite — China Mainland
 ASX 200 — Australian Market
 TSX Composite — Canada Index
 Nifty 50 — India Large Cap
 STI Index — Singapore Market
 KOSPI — South Korea Index
 Bovespa — Brazil Equities
 JSE Top 40 — South Africa Index
 IPC Index — Mexico Market
- Bitcoin hovers above $65,000 on Wednesday, following a minor pullback the previous day.
- Uniswap is up roughly 8% on Wednesday, testing the breakout of a crucial long-term resistance trendline.
- Worldcoin edges higher toward $0.70 following a 15% jump the previous day.
Bitcoin (BTC) is experiencing headwinds above $65,000 following the Bank of Japan’s rate hike to 1% on Tuesday. Still, Uniswap (UNI) and Worldcoin (WLD) continue to rally amid rising retail interest, while Bitcoin’s recovery grows heavy.
Bitcoin waits above $65,000 as recovery hinders
Bitcoin edges higher at press time on Wednesday, inching closer to $66,000 as it maintains a mixed near-term tone following the recent rebound from $60,000. Still, BTC remains below the 50-, 100-, and 200-day Exponential Moving Averages (EMAs), clustered between roughly $70,300 and $78,300.
The loss of the former rising trendline, now acting as resistance around $72,851.77, reinforces a capped structure, while the Relative Strength Index (RSI) at 42 on the daily chart hints at weak but stabilizing downside momentum. At the same time, the Moving Average Convergence Divergence (MACD) remains positive but moderating, suggesting that recent recovery attempts lack decisive follow-through.
On the topside, initial resistance is seen at the 50-day EMA near $70,345, followed by the trendline barrier around $72,852 and the 100-day EMA at $73,045, with the 200-day EMA higher up near $78,333 acting as a broader bearish pivot.

On the downside, the key structural floor sits at the horizontal support zone around $60,000, where a break would expose further weakness and extend the prevailing corrective phase.
Uniswap prepares for a trendline breakout rally
Uniswap trades above $3.00 at press time on Wednesday, extending the recovery run for the seventh consecutive day. This rebound aligns with rising renewed retail interest and Uniswap’s collaboration with Arc to provide deep stablecoin liquidity.
The pair has pushed above its 50- and 100-day EMAs and is testing a local resistance trendline near $3.50, hinting at a constructive near-term bias. Momentum is strong, as the RSI at 70 hovers just near the overbought territory while the MACD extends above its signal line, suggesting bullish pressure is still in play.
A decisive close above the trendline near $3.50 would position the 200-day EMA at $4.08 as the next notable resistance. A clear break above this longer-term average would open the door for a more sustained advance.
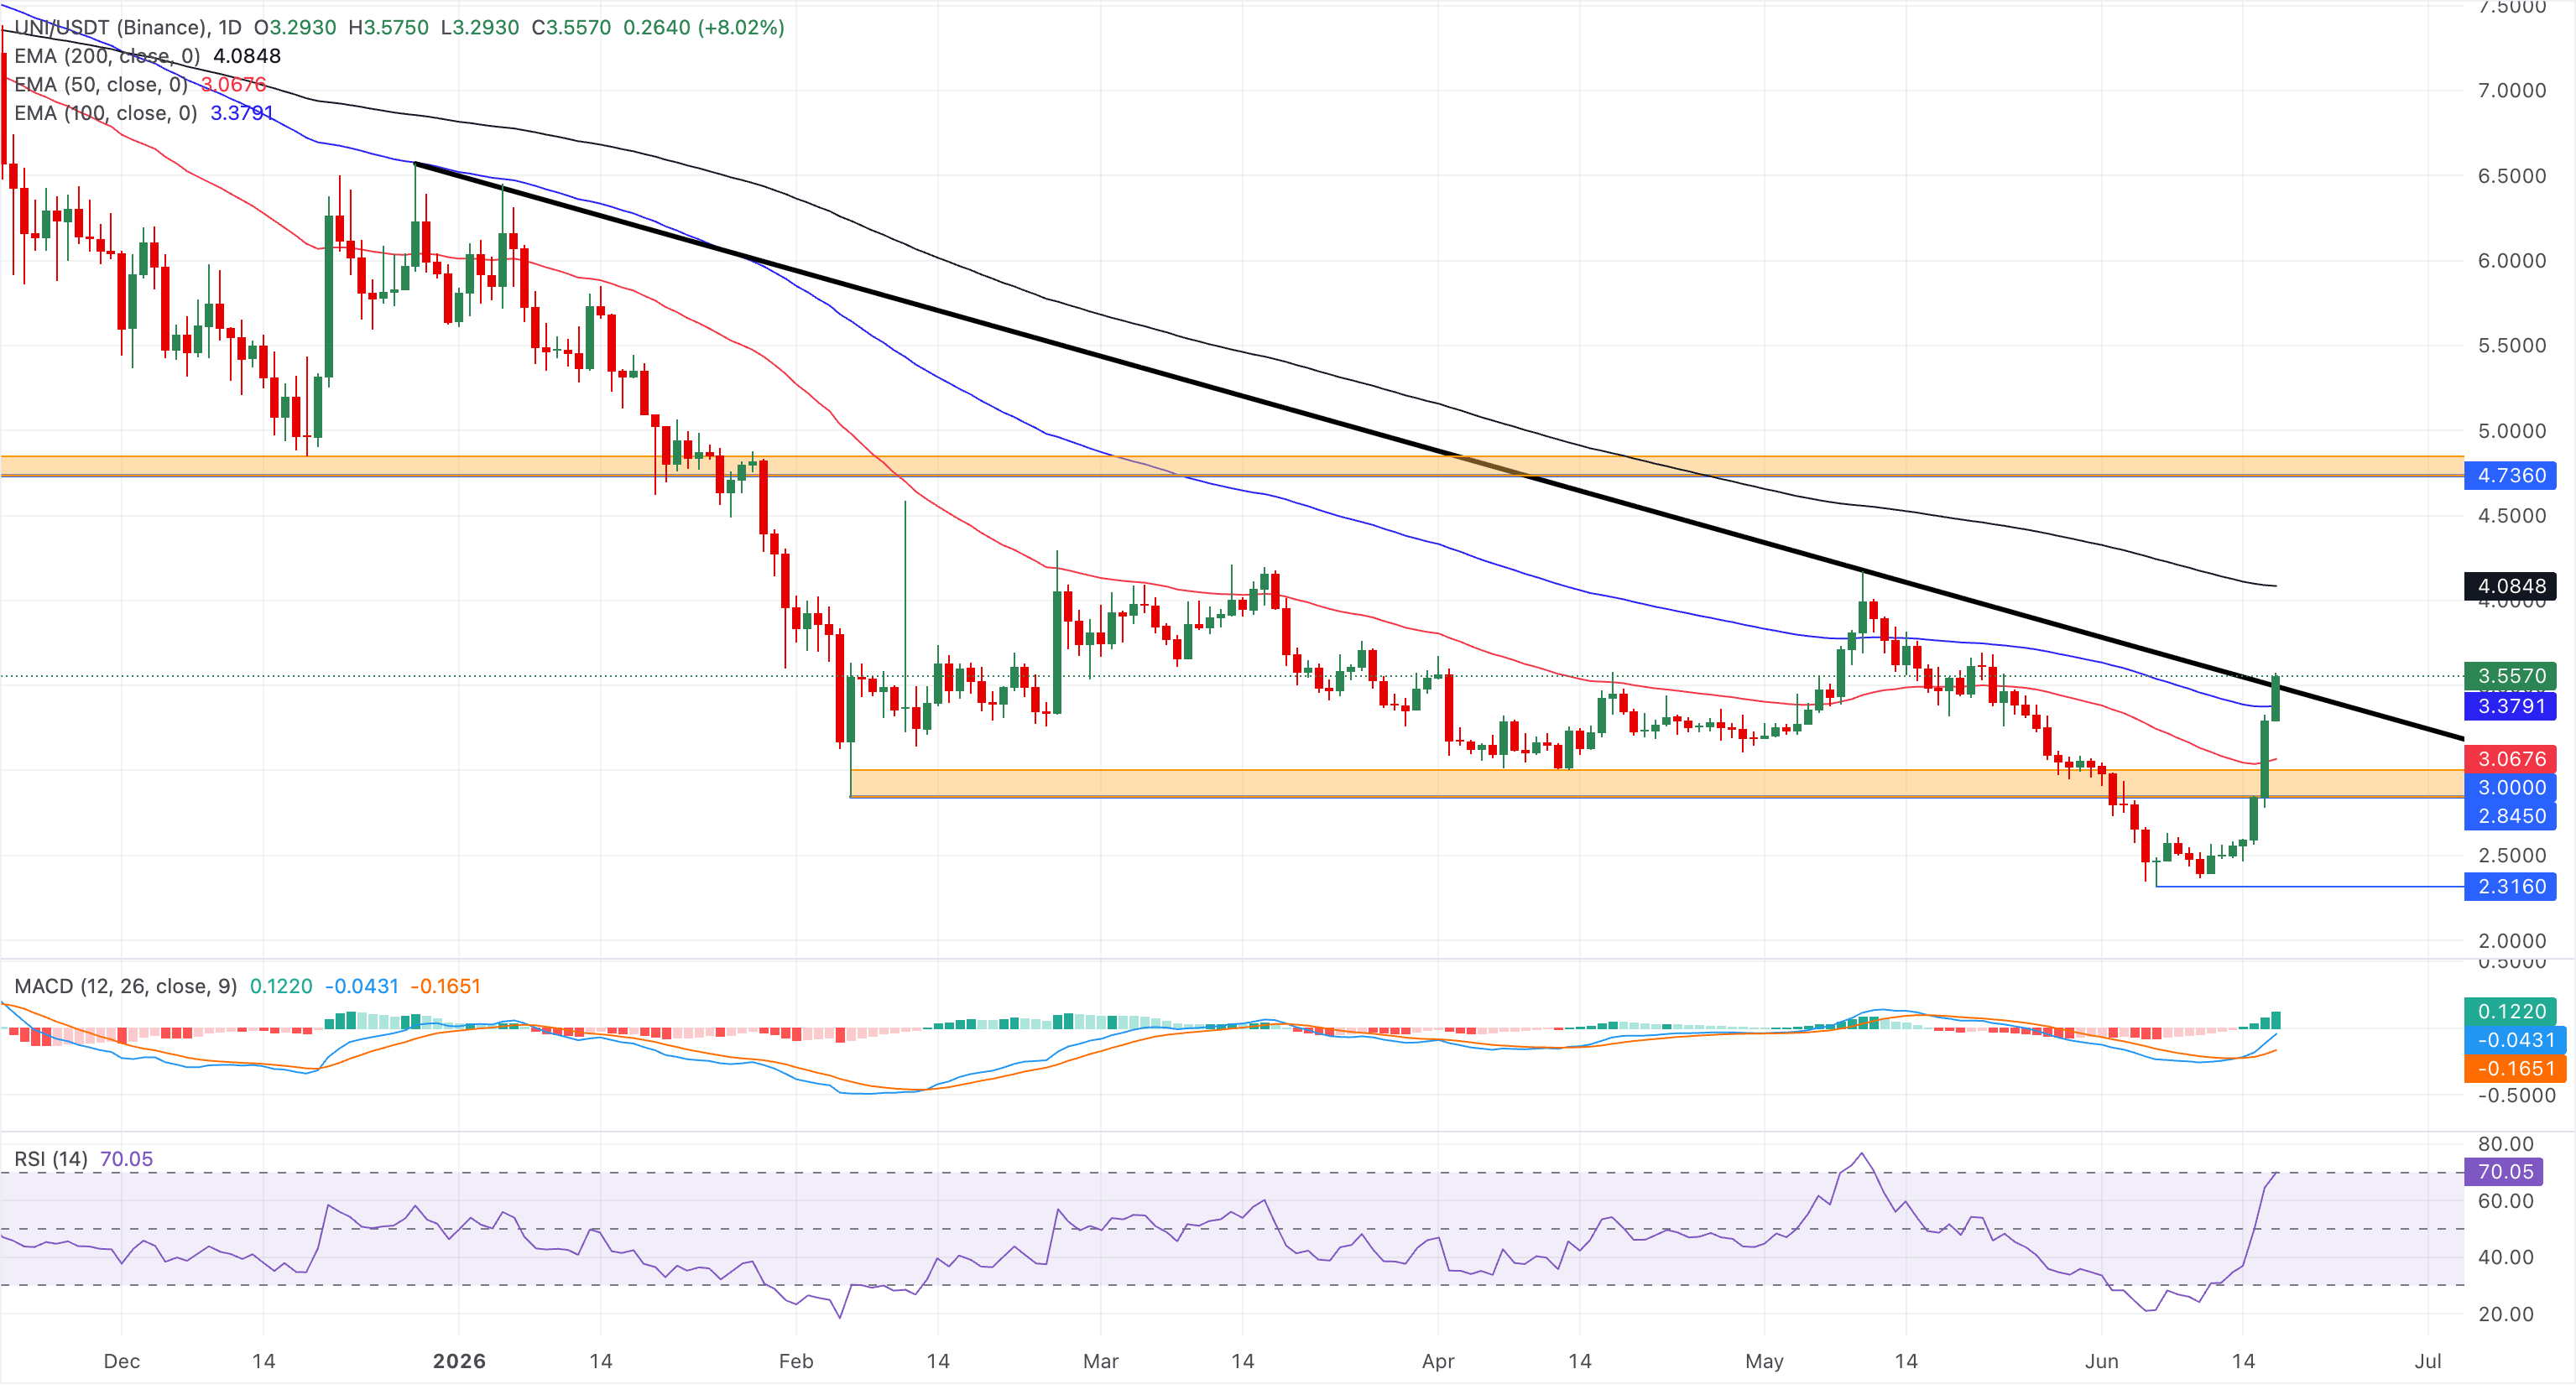
Looking down, initial support is seen near the 100-day EMA at $3.37 and the 50-day EMA near $3.07, reinforcing a broader demand zone on pullbacks.
Worldcoin rally gains traction
Worldcoin has been trading in the green over the last five days, inching closer to the $0.70 mark at press time. WLD maintains a clear bullish bias as price holds well above the 50-, 100-, and 200-period EMAs between roughly $0.38 and $0.46.
That said, the RSI at 71 points to overbought conditions on the daily chart that could slow the advance rather than immediately reverse it. Meanwhile, the positive MACD histogram continues to expand as the average line extends higher above the zero line, hinting that upside momentum is stretching.
Looking up, the October 17 low at $0.82, followed by the $1.00 psychological threshold, could serve as overhead barriers.
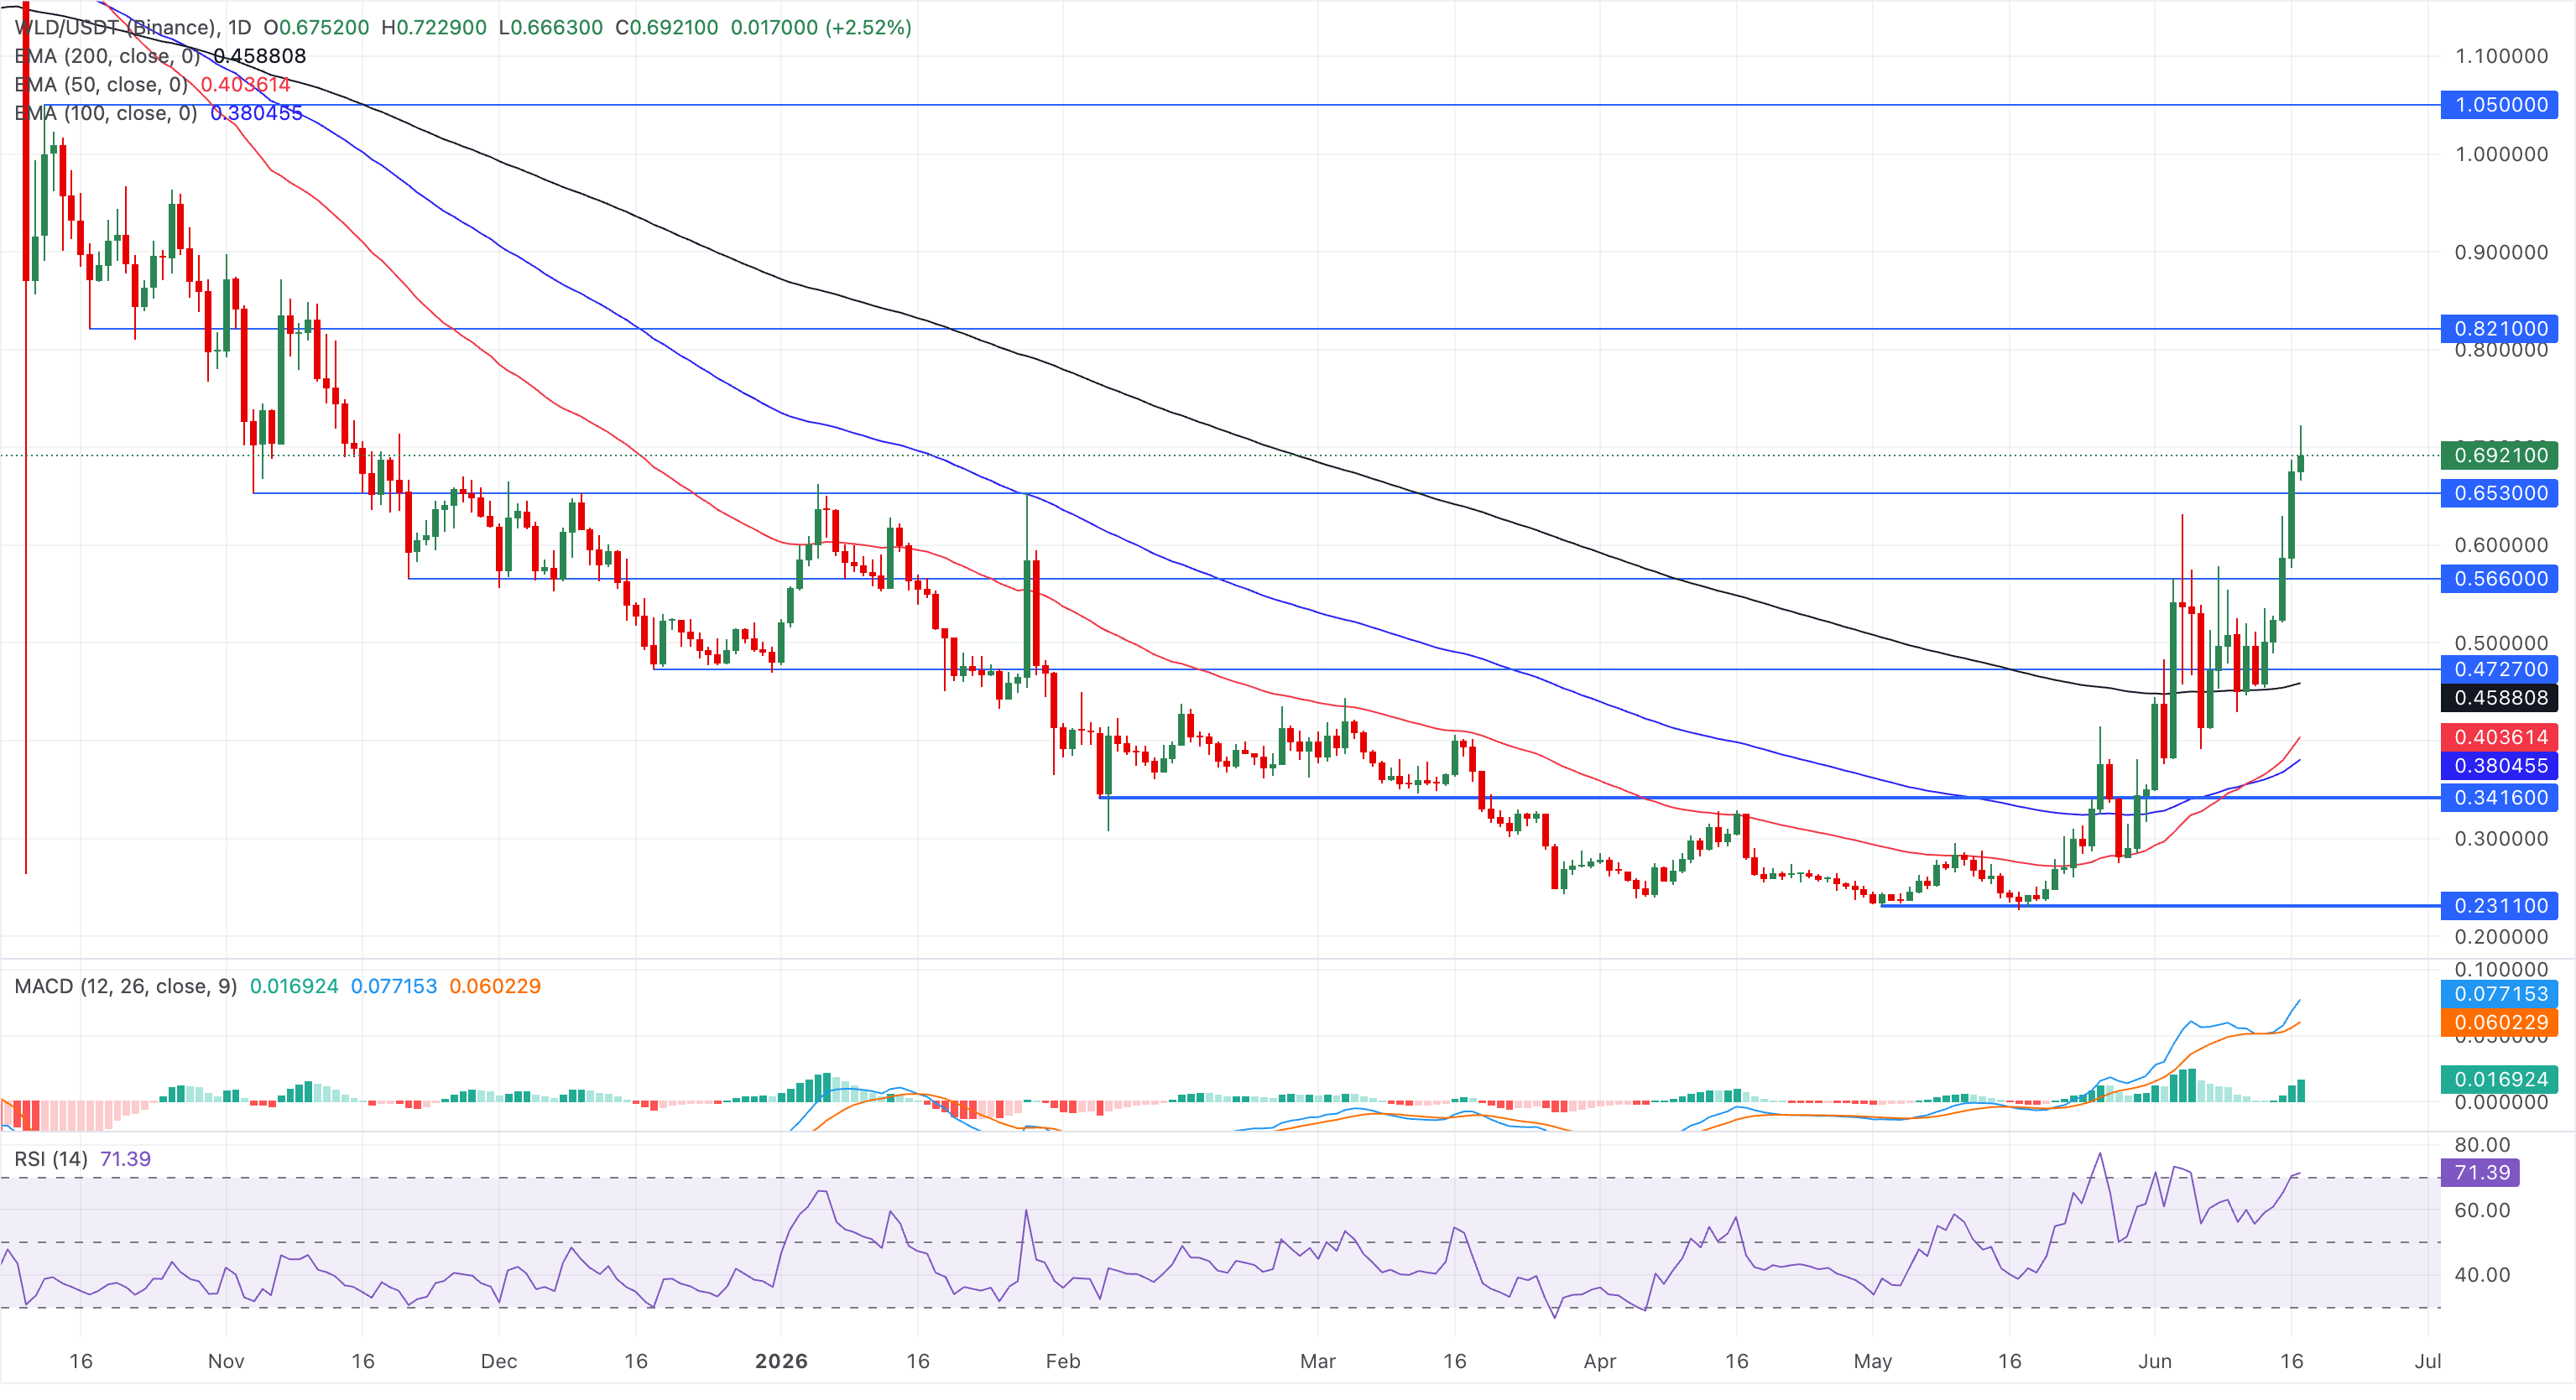
A slip below $0.65 could erase some gains from the five-day recovery, risking a reversal to the $0.56 support floor, followed by the $0.50 psychological level.