S&P 500 — US Large Cap Index
 FTSE 100 — UK Blue Chips
 Euro Stoxx 50 — Eurozone Leaders
 DAX 40 — German Equities
 CAC 40 — French Market Index
 Nikkei 225 — Japan Benchmark
 Hang Seng — Hong Kong Index
 Shanghai Composite — China Mainland
 ASX 200 — Australian Market
 TSX Composite — Canada Index
 Nifty 50 — India Large Cap
 STI Index — Singapore Market
 KOSPI — South Korea Index
 Bovespa — Brazil Equities
 JSE Top 40 — South Africa Index
 IPC Index — Mexico Market

This analysis from the Overbalance series aims to identify three financial instruments, analysed primarily on the daily/four-hour (D1/H4) timeframe. The analysis utilises solely the Overbalance methodology, which enables the identification of points where a trend may continue or where a reversal may occur. Today’s analysis covers three instruments, assessed solely in terms of their 1:1 correction patterns GBPAUD The GBPAUD exchange rate remains within a long-term downtrend. In June and July this year, we observed an attempt to break out of the green geometric pattern, the upper boundary of which was at the 1.9190 level. However, the price failed to break above this level on a sustained basis and, furthermore, did not breach the 127.2% retracement level of the entire green correction – a breach of which would have been required to trigger a shift to an uptrend. The price therefore returned within the pattern below the 1.9190 level and subsequently extended its downward movement. Furthermore, the local upward trend line drawn from the May low was negated, with its lower boundary at the 1.9111 level. According to the Overbalance methodology, this increases the likelihood of a further deepening of the decline towards the mid-May low, i.e. around 1.8584.
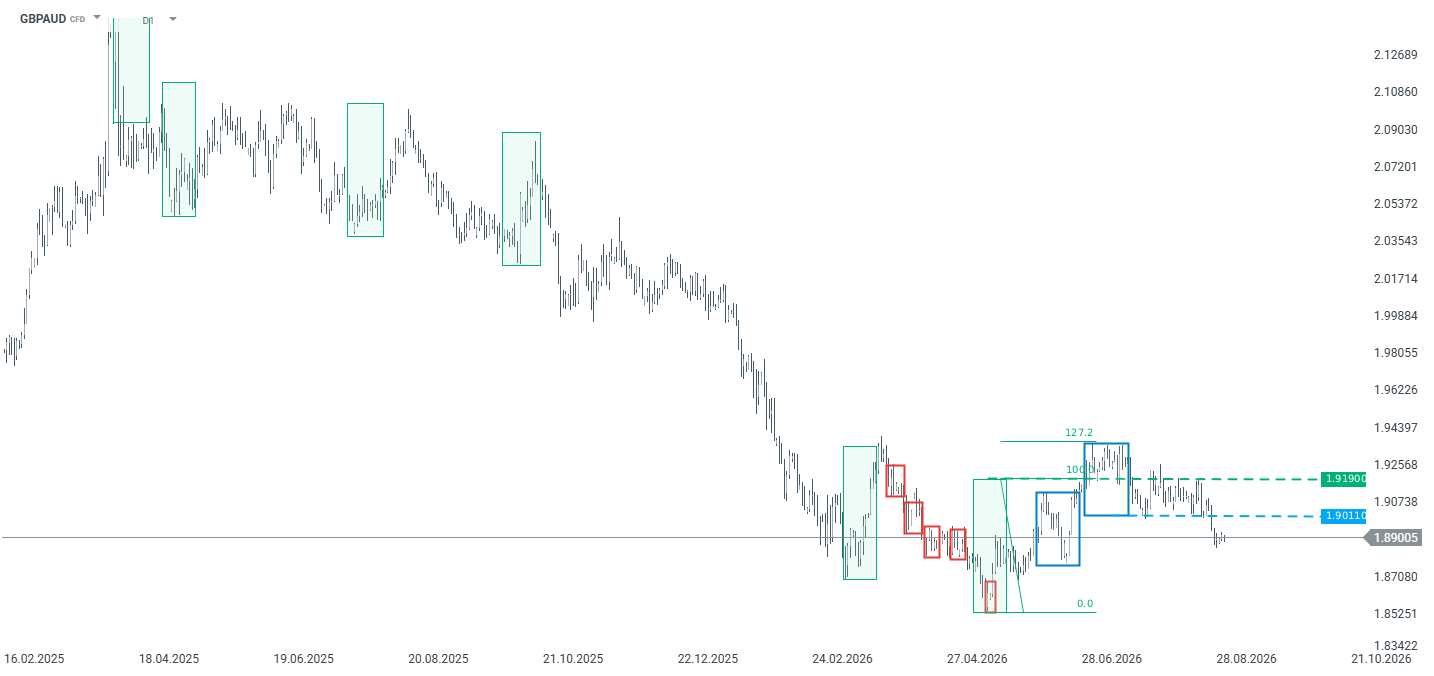
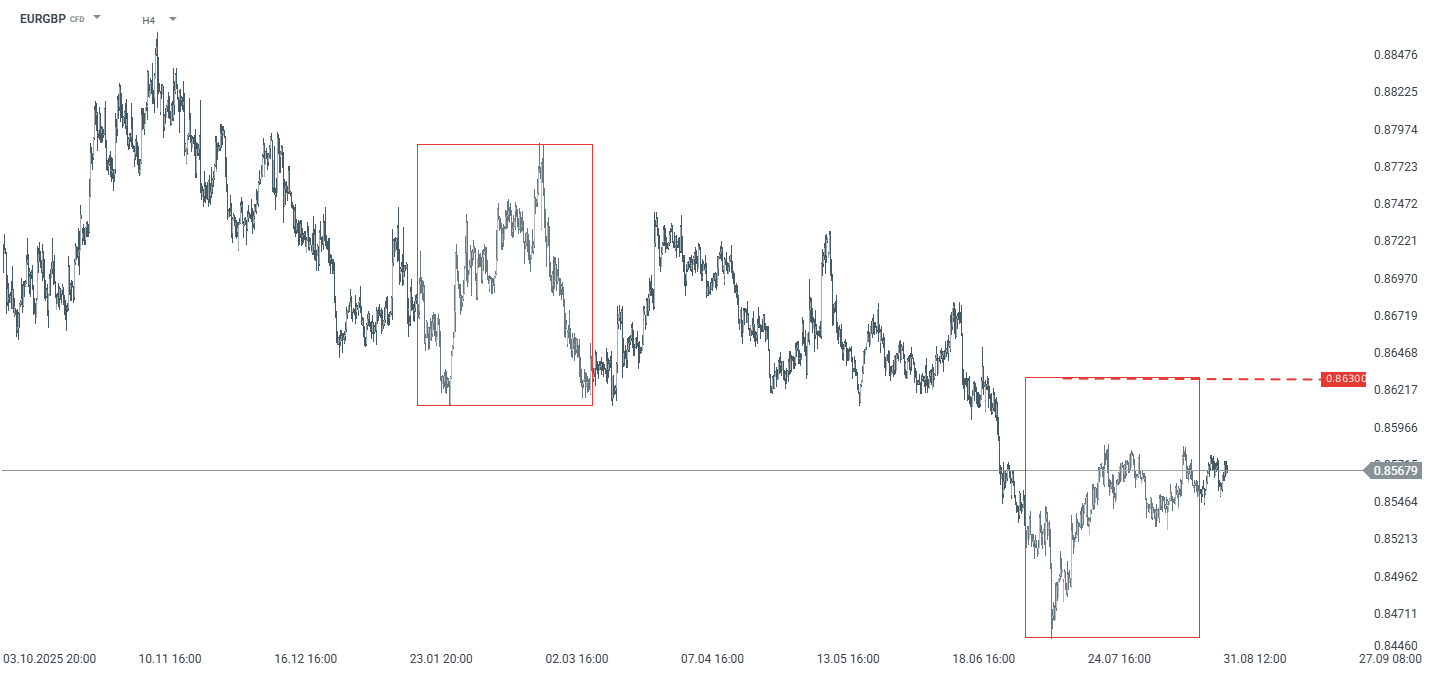
GBPAUD – H4 timeframe. Source: xStation5 EURGBP The EURGBP exchange rate has been on a downward trend since November 2025. The largest correction, which may contain the entire downward move, is approximately 170 pips and is marked in red. If the current upward correction continues, the key resistance level remains at 0.8630, which marks the upper boundary of the aforementioned pattern. According to the Overbalance methodology, as long as the price remains within the red pattern, the downtrend remains in place. Only a sustained break above 0.8630 could alter the current scenario.
EURGBP – H4 timeframe. Source: xStation5 GBP/CAD GBPCAD prices followed an upward trend from May to July, after which a significant correction took place; we are now seeing a shift in sentiment according to the Overbalance methodology. Currently, the largest correction within the local downtrend is the pattern marked in red, with its upper boundary at 1.8924. Despite the lack of significant downward momentum, the price remains within this pattern; therefore, the main scenario anticipates a move towards the low of 29 July, around 1.8710. Conversely, for a return to an uptrend to be considered, the price would need to break above the 1.8924 level on a sustained basis.
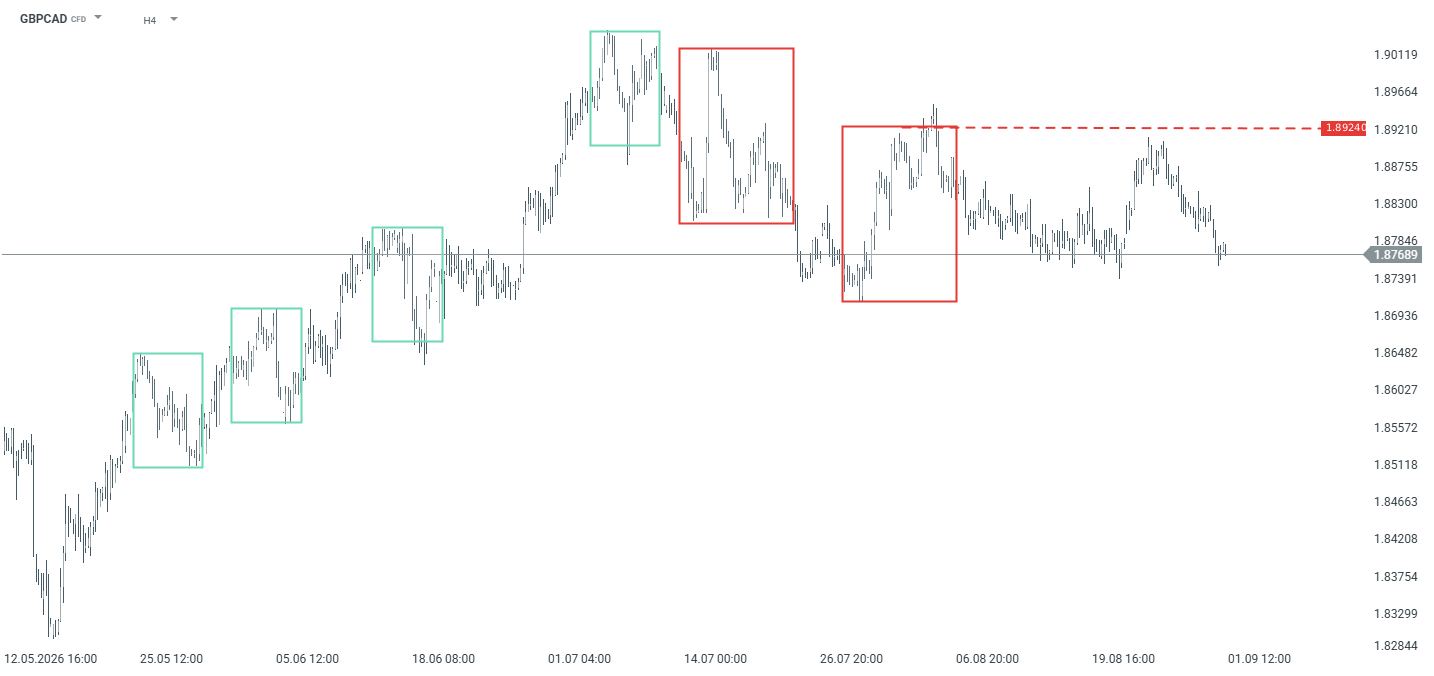
GBPCAD – H4 timeframe. Source: xStation5