S&P 500 — US Large Cap Index
 FTSE 100 — UK Blue Chips
 Euro Stoxx 50 — Eurozone Leaders
 DAX 40 — German Equities
 CAC 40 — French Market Index
 Nikkei 225 — Japan Benchmark
 Hang Seng — Hong Kong Index
 Shanghai Composite — China Mainland
 ASX 200 — Australian Market
 TSX Composite — Canada Index
 Nifty 50 — India Large Cap
 STI Index — Singapore Market
 KOSPI — South Korea Index
 Bovespa — Brazil Equities
 JSE Top 40 — South Africa Index
 IPC Index — Mexico Market

This analysis from the Overbalance series aims to identify three financial instruments, analyzed primarily on the daily/four-hour (D1/H4) timeframe. The analysis uses only the Overbalance methodology, which helps determine where a trend may continue or where a reversal might occur.
Today’s analysis covers three instruments, evaluated solely in terms of 1:1 correction structures.
GBPUSD
GBPUSD prices have been trending downward for quite some time, but on April 8, the 1:1 geometry was negated, which, according to the Overbalance methodology, paves the way for a larger correction or even a shift to an uptrend. Currently, the 1.3360–1.3355 zone should be treated as key support, where both the polarity of the negated downward geometry and the lower boundary of the local 1:1 upward pattern are located. As long as the price remains above this zone, the bullish sentiment prevails. Only a drop below 1.3355 could push the market back toward declines.
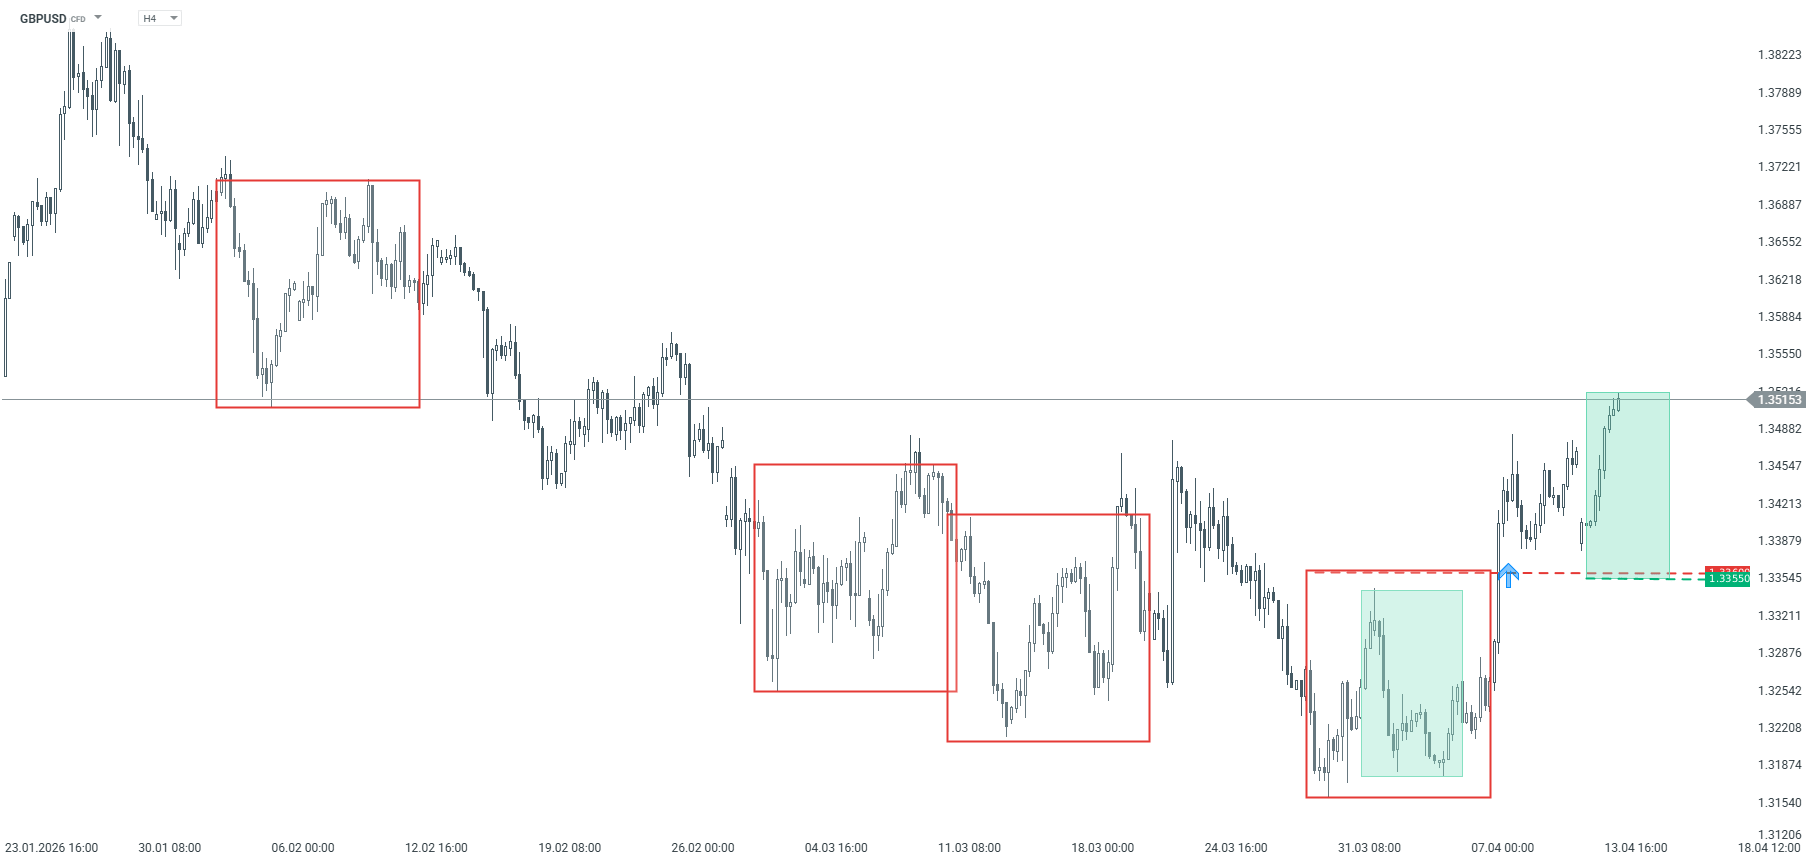
GBPUSD – H4 chart. Source: xStation
GBPJPY
GBPJPY has been in an uptrend for some time now. The last two corrections were of identical magnitude, as indicated by the green rectangles, confirming the market’s rhythm in line with the Overbalance methodology. Currently, the price is trading near local highs. In the event of a correction, the key support level remains at 212.33, derived from the 1:1 ratio. At this point, there are no clear supply signals, so the base case scenario remains a continuation of the uptrend.
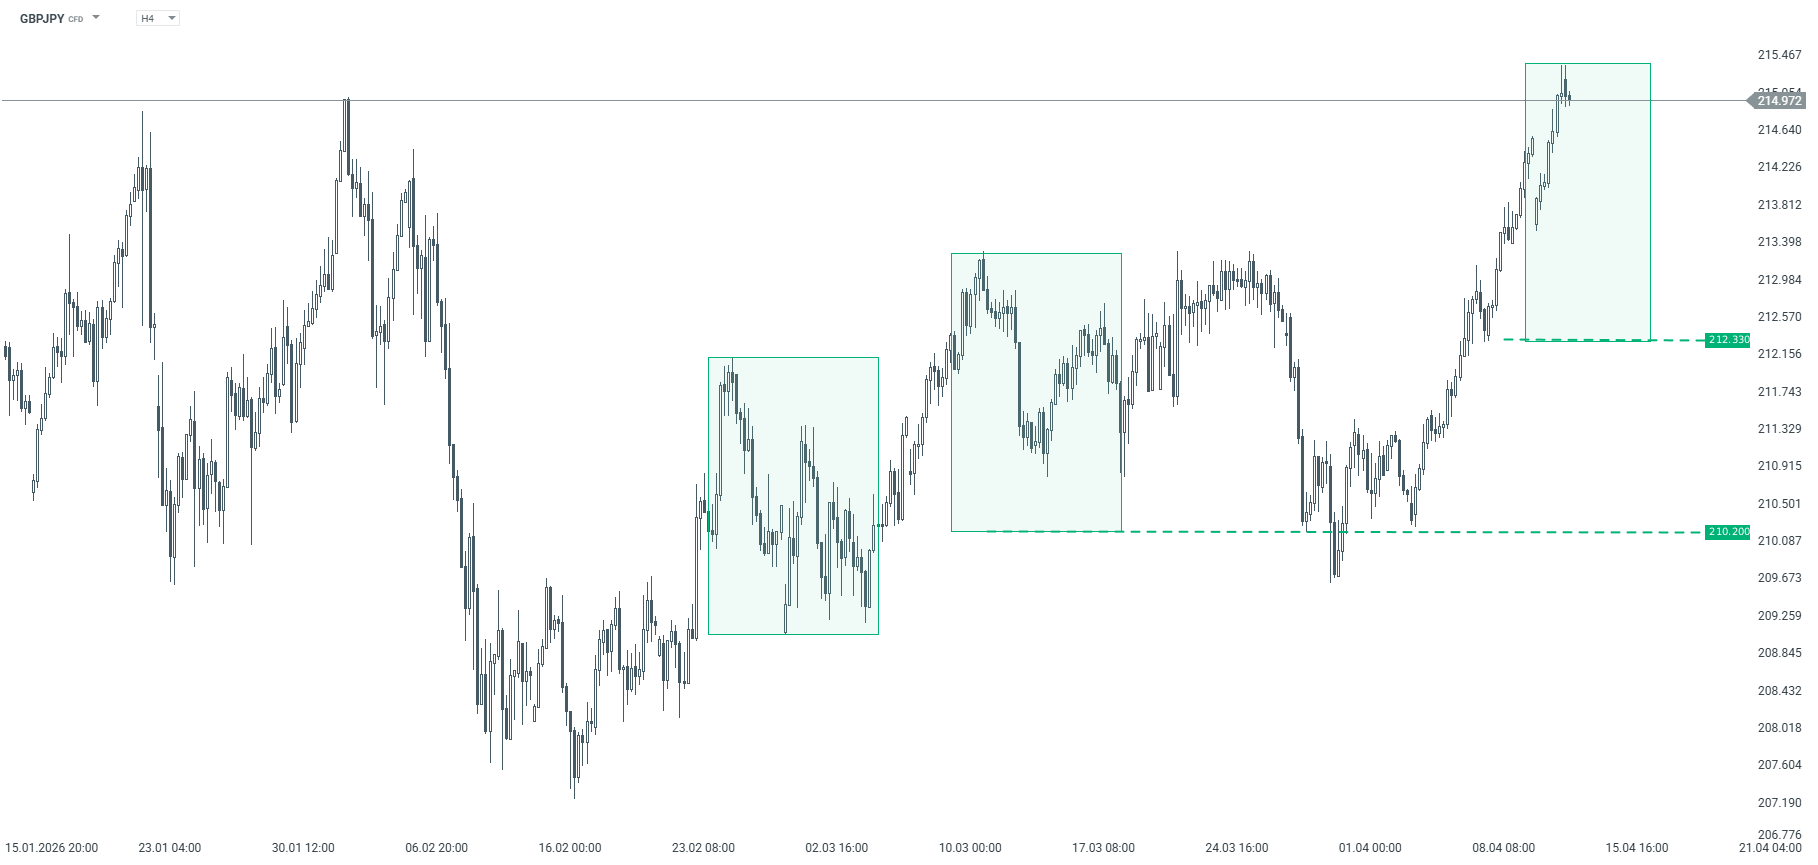
GBPJPY – H4 timeframe. Source: xStation
USDCHF
The USDCHF pair rebounded from key resistance at the 0.8042 level, which stems from the largest corrective pattern within the downtrend that has been ongoing since January 2025. Additionally, the price fell below the 0.7902 level, which is the upper boundary of a smaller 1:1 pattern; according to the Overbalance methodology, this supports the scenario of further declines toward the January lows. To signal a shift to an uptrend, prices would need to break above the 0.8042 level; however, this is not the base case scenario at this time.
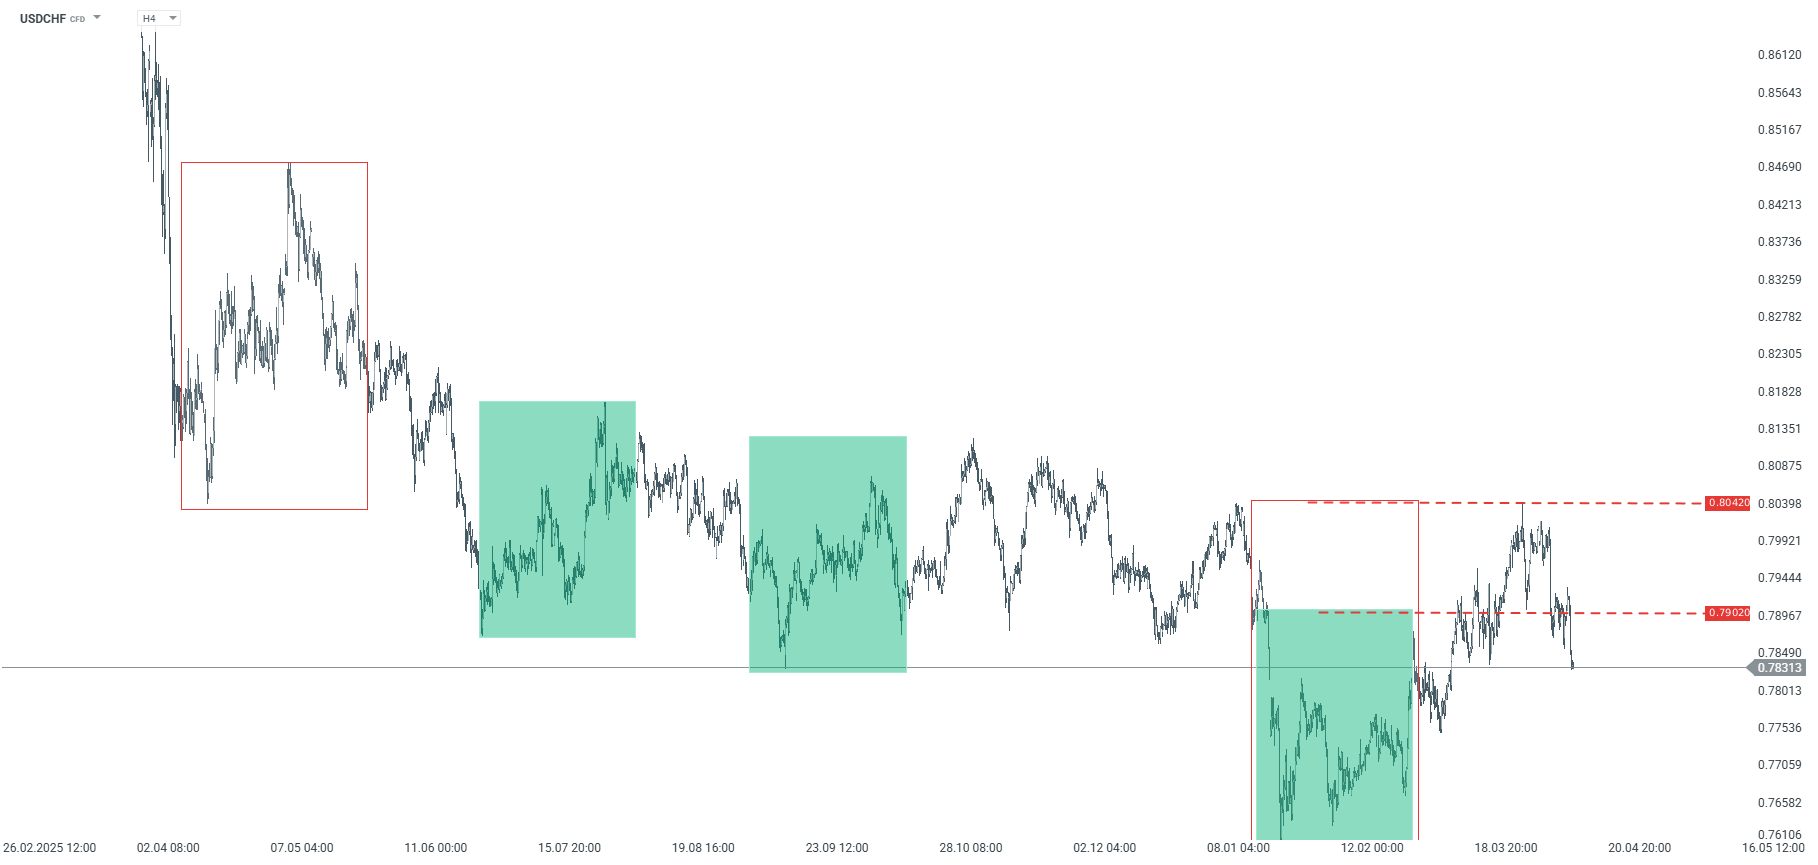
USDCHF – H4 timeframe. Source: xStation
The material on this page does not constitute financial advice and does not take into account your level of understanding, investment objectives, financial situation or any other specific needs. All information provided, including opinions, market research, mathematical results and technical analyzes published on the Website or transmitted To you by other means, it is provided for information purposes only and should in no way be construed as an offer or solicitation for a transaction in any financial instrument, nor should the information provided be construed as advice of a legal or financial nature on which any investment decisions you make should be based exclusively To your level of understanding, investment objectives, financial situation, or other specific needs, any decision to act on the information published on the Website or sent to you by other means is entirely at your own risk if you In doubt or unsure about your understanding of a particular product, instrument, service or transaction, you should seek professional or legal advice before trading. Investing in CFDs carries a high level of risk, as they are leveraged products and have small movements Often the market can result in much larger movements in the value of your investment, and this can work against you or in your favor. Please ensure you fully understand the risks involved, taking into account investments objectives and level of experience, before trading and, if necessary, seek independent advice.