S&P 500 — US Large Cap Index
 FTSE 100 — UK Blue Chips
 Euro Stoxx 50 — Eurozone Leaders
 DAX 40 — German Equities
 CAC 40 — French Market Index
 Nikkei 225 — Japan Benchmark
 Hang Seng — Hong Kong Index
 Shanghai Composite — China Mainland
 ASX 200 — Australian Market
 TSX Composite — Canada Index
 Nifty 50 — India Large Cap
 STI Index — Singapore Market
 KOSPI — South Korea Index
 Bovespa — Brazil Equities
 JSE Top 40 — South Africa Index
 IPC Index — Mexico Market


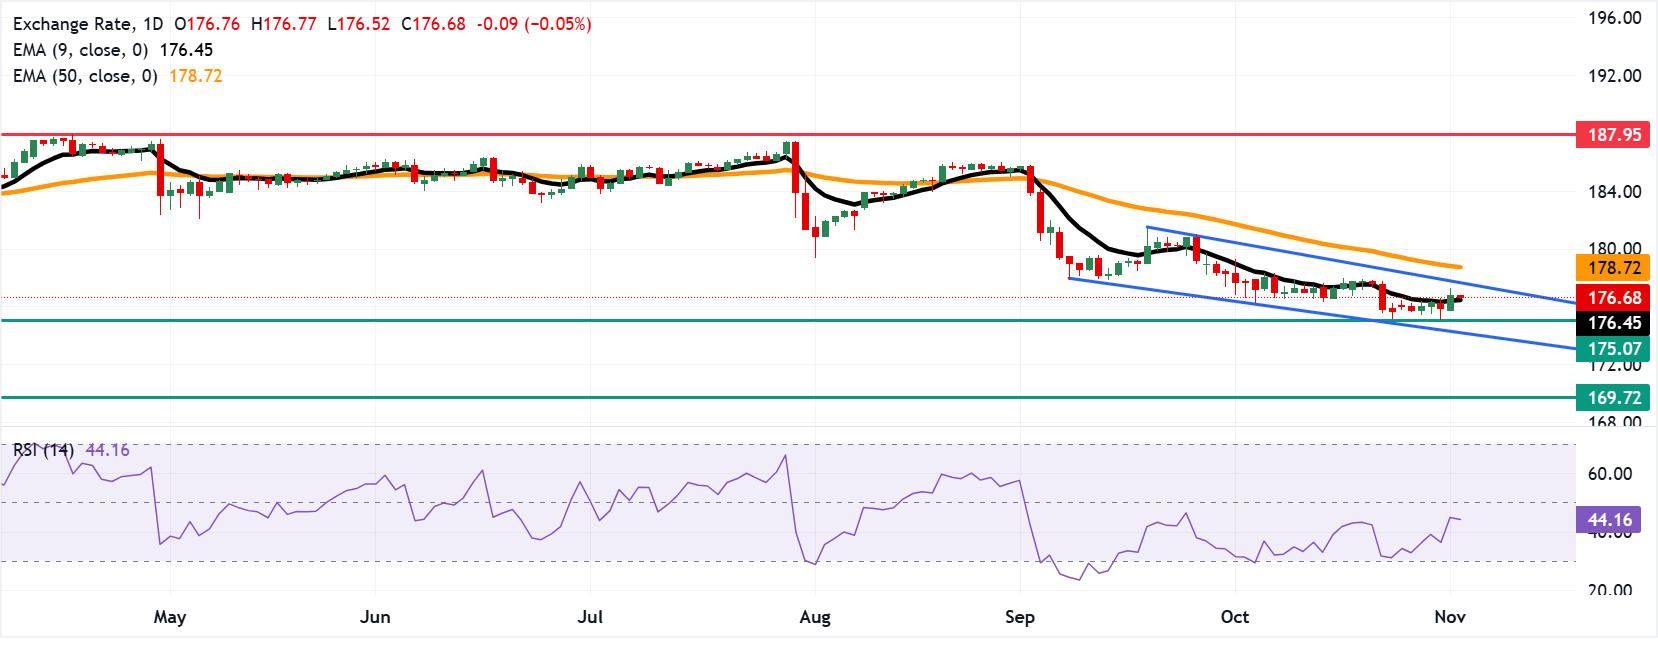
- EUR/JPY may test the immediate support at the nine-day EMA of 176.45.
- The 14-day Relative Strength Index is at 44.16, suggesting modest downside momentum.
- The primary barrier lies at the descending channel’s upper boundary near 177.90.
EUR/JPY inches lower after posting modest gains in the previous day, trading around 176.70 during Asian hours on Tuesday. The technical analysis of the daily chart suggests that the currency cross is remaining within a descending channel pattern, indicating a prevailing bearish bias.
The EUR/JPY cross is holding just above the nine-period Exponential Moving Average (EMA) but still capped by the 50-period EMA. This setup hints at a mildly bearish undertone, as price remains below the longer-term EMA, while the 14-day Relative Strength Index (RSI) at 44.16 stays in neutral territory, suggesting only modest downside momentum rather than aggressive selling.
The EUR/JPY cross tests the immediate support at the nine-day EMA of 176.45, followed by the 12-month low of 175.07, reached on October 30. Further support lies at the lower boundary of its descending channel around 174.30. A break below the channel would open the door for the currency cross to navigate the region around the 15-month low at 169.72.
On the upside, the EUR/JPY cross may rise toward the upper boundary of the descending channel near 177.90, followed by the 50-day EMA of 178.72. A successful break above the medium-term price average would cause a bullish reversal, supporting the EUR/JPY cross to explore the area around the all-time high of 187.95, reached on April 17.
Euro appeal tempered by Europe’s fiscal and energy headwinds
Analysts at DBS Group Research caution that the Dollar’s loss of momentum does not automatically make the Euro a compelling alternative, highlighting that “Europe’s fiscal and political uncertainties, particularly in France, and its vulnerability to elevated energy prices complicate the search for viable alternatives.” These overlapping risks, they suggest, limit the extent to which investors can confidently rotate out of the Dollar and into Eurozone assets despite recent currency moves.