- EUR/USD attracts some buyers to around 1.1330 in Wednesday’s early European session, up 0.42% on the day.
- The positive view of the pair prevails above the key 100-day EMA with the bullish RSI indicator.
- The immediate resistance level emerges at 1.1382; the first support level to watch is 1.1211.
The EUR/USD pair gathers strength to near 1.1330 during the early European session on Wednesday, bolstered by a weaker US Dollar (USD). The “sell America” theme continues after Moody’s lowered the US rating from ‘Aaa’ to ‘Aa1’, citing that successive US administrations had failed to reverse ballooning deficits and interest costs.
Technically, the constructive outlook of EUR/USD remains in place as the major pair is well-supported above the key 100-day Exponential Moving Average (EMA) on the daily chart. The upward momentum is reinforced by the Relative Strength Index (RSI), which stands above the midline near 57.45, displaying bullish momentum in the near term.
On the bright side, the first upside barrier emerges at 1.1382, the high of May 6. A decisive break above this level could pick up more momentum and aim for 1.1455, the upper boundary of the Bollinger Band. Further north, the next resistance level is seen at 1.1574, the high of April 21.
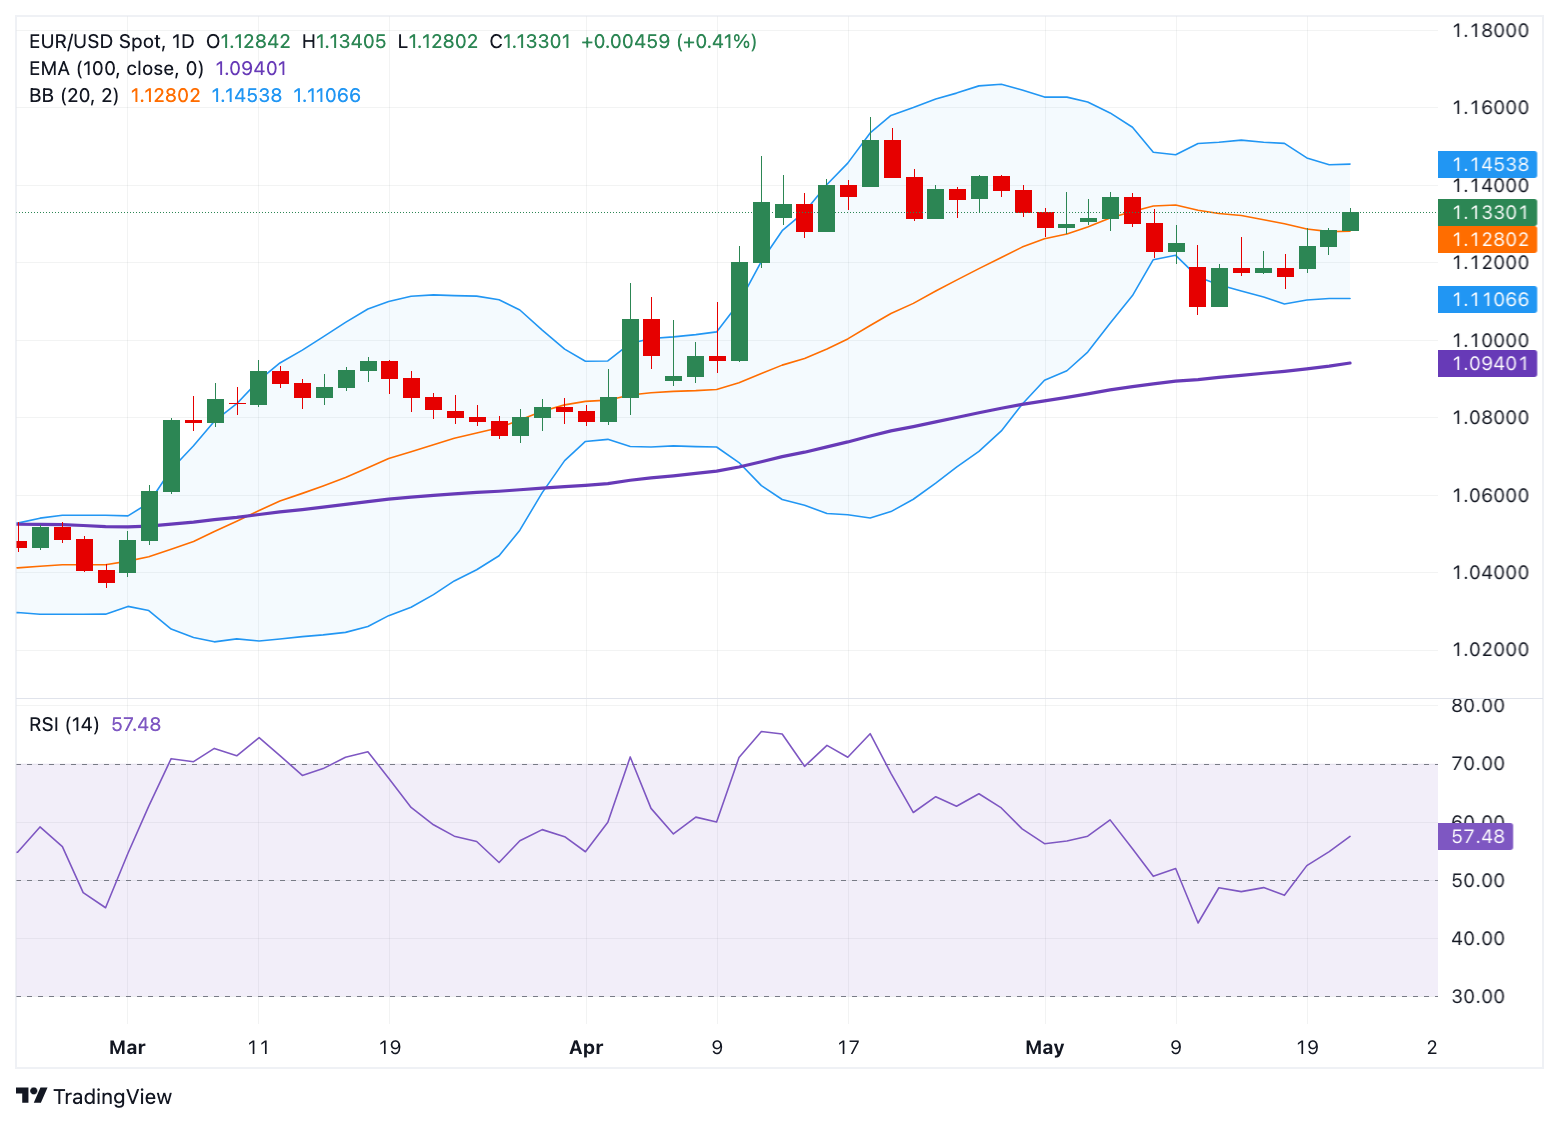
In the bearish case, the low of May 8 at 1.1211 acts as an initial support level for EUR/USD. A breach of this level could drag the major pair toward 1.1106, the lower limit of the Bollinger Band. The additional downside filter to watch is 1.0940, the 100-day EMA.
EUR/USD daily chart