S&P 500 — US Large Cap Index
 FTSE 100 — UK Blue Chips
 Euro Stoxx 50 — Eurozone Leaders
 DAX 40 — German Equities
 CAC 40 — French Market Index
 Nikkei 225 — Japan Benchmark
 Hang Seng — Hong Kong Index
 Shanghai Composite — China Mainland
 ASX 200 — Australian Market
 TSX Composite — Canada Index
 Nifty 50 — India Large Cap
 STI Index — Singapore Market
 KOSPI — South Korea Index
 Bovespa — Brazil Equities
 JSE Top 40 — South Africa Index
 IPC Index — Mexico Market


- EUR/USD recovers further to near 1.1210 as the US Dollar corrects.
- Investors keenly await the US CPI data for September.
- The Fed and the ECB are expected to keep interest rates on hold.
The Euro (EUR) extends its Tuesday’s strong recovery move to near 1.1210 against the US Dollar (USD) during the Asian trade on Wednesday. The major currency pair attracts bids due to the correction in the US Dollar amid the pause in United States (US) Treasury Yields’ rally remaining intact ahead of the Consumer Price Index (CPI) data for September.
10-year US Treasury Yields have corrected to near 5.20% from its recent multi-decade high of 5.36%. The US Dollar Index (DXY), which gauges the Greenback’s value against six major currencies, trades 0.1% lower to near 102.10. The DXY has retreated from its yearly high of 102.61 posted on Monday.
According to estimates, both headline and the core CPI grew at a faster pace of 3.6% and 2.5% Year-on-Year (YoY), respectively. Analysts at Societe Generale see the Federal Reserve’s (Fed) policy outlook remaining largely unchanged even if core CPI rises to 2.5% YoY.
Currently, the CME FedWatch tool shows traders are confident that the Fed will leave interest rates unchanged in the policy meeting later this month and will deliver a hike in December.
Meanwhile, French fiscal risks due to ballooning public debt and firm expectations that the European Central Bank (ECB) will keep interest rates unchanged this month will likely cap the upside in the Euro.
According to a Reuters poll conducted October 5-8, 70 of 73 economists expect the ECB to hold its deposit rate at 2.50% on October 29.
EUR/USD Technical Analysis
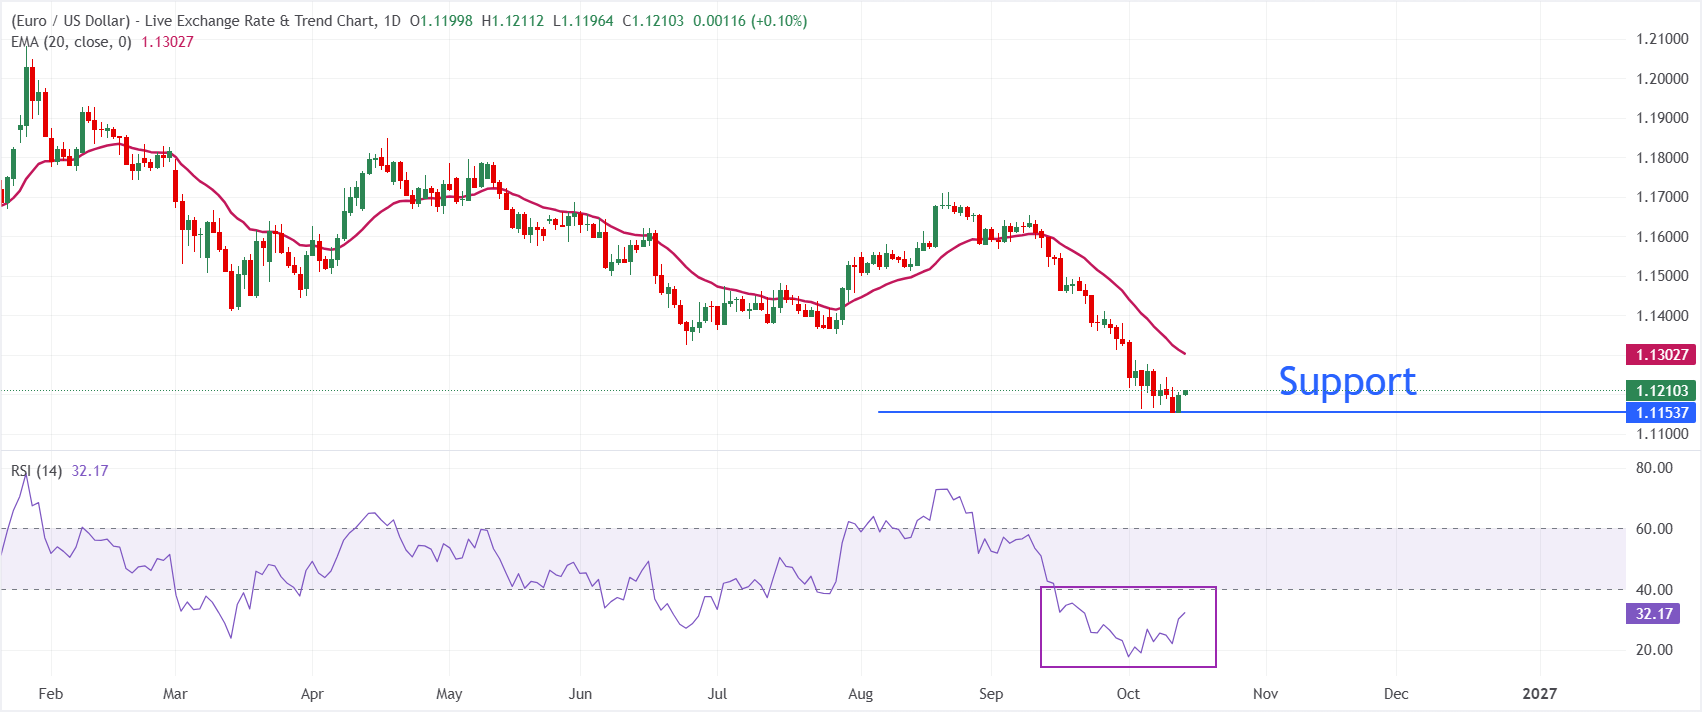
In the daily chart, EUR/USD trades at 1.1210, holding a bearish near-term bias as spot remains below the 20-period exponential moving average (EMA) at 1.1303.
The pair continues to be capped by this dynamic barrier, which reinforces the broader downside tone while the Relative Strength Index (RSI) at 32.15 hovers just above oversold territory, hinting that selling pressure is still dominant but not yet exhausted.
On the topside, initial resistance is located at the 20-period EMA around 1.1303, and a daily close above this level would be needed to ease the current bearish pressure and open the door to a deeper corrective bounce. On the downside, the October 12 low at 1.1153 is the immedaite support level; a decisive break below the same would expose the pair to 1.1100.