S&P 500 — US Large Cap Index
 FTSE 100 — UK Blue Chips
 Euro Stoxx 50 — Eurozone Leaders
 DAX 40 — German Equities
 CAC 40 — French Market Index
 Nikkei 225 — Japan Benchmark
 Hang Seng — Hong Kong Index
 Shanghai Composite — China Mainland
 ASX 200 — Australian Market
 TSX Composite — Canada Index
 Nifty 50 — India Large Cap
 STI Index — Singapore Market
 KOSPI — South Korea Index
 Bovespa — Brazil Equities
 JSE Top 40 — South Africa Index
 IPC Index — Mexico Market
European Stocks Caught Between a Geopolitical Rock and a Hard Place


European markets have opened the week without a clear direction — the pan-European STOXX 600 is down by around 0.2%, the DAX is trading almost flat, and the CAC 40 is down by a few tenths of a percentage point. The Italian FTSE MIB is performing best among the major indices, gaining around 0.4%, whilst the London FTSE 100 is closed today due to a UK bank holiday. The main factor weighing on the market is the threat of new tariffs from the Trump administration — on Friday, the president announced an increase in tariffs on cars and lorries from the EU from 15% to 25%, citing Europe’s failure to comply with the trade agreement. The European Commission has stated that it is considering a response, but transatlantic tensions have clearly returned to the market. At the same time, investors’ attention is drawn to the situation in the Persian Gulf — a tanker reported being hit in the Strait of Hormuz shortly after Trump announced ‘Project Freedom’, an initiative involving the escort of ships through the strait with the participation of 15,000 troops. WTI crude is up by over 3.4%, whilst Brent is rising by around 3.4%, pushing prices to the $105–112 range. The dollar (USDIDX) remains close to 98.2, virtually unchanged at the start of the week. At sector level, technology and defence are leading the way — Nokia is up over 6% to a 17-year high, SAP is up nearly 2%, and Rheinmetall is up 3%. Semiconductor firms STMicroelectronics and Aixtron are both up by around 4–4.5%. At the other end of the spectrum are the automotive sector (the sector index is down 1.1%), utilities (–1.2%) and food and drink (–0.6%), where Heineken, Carlsberg and Anheuser-Busch are each down 1.5–1.7%.
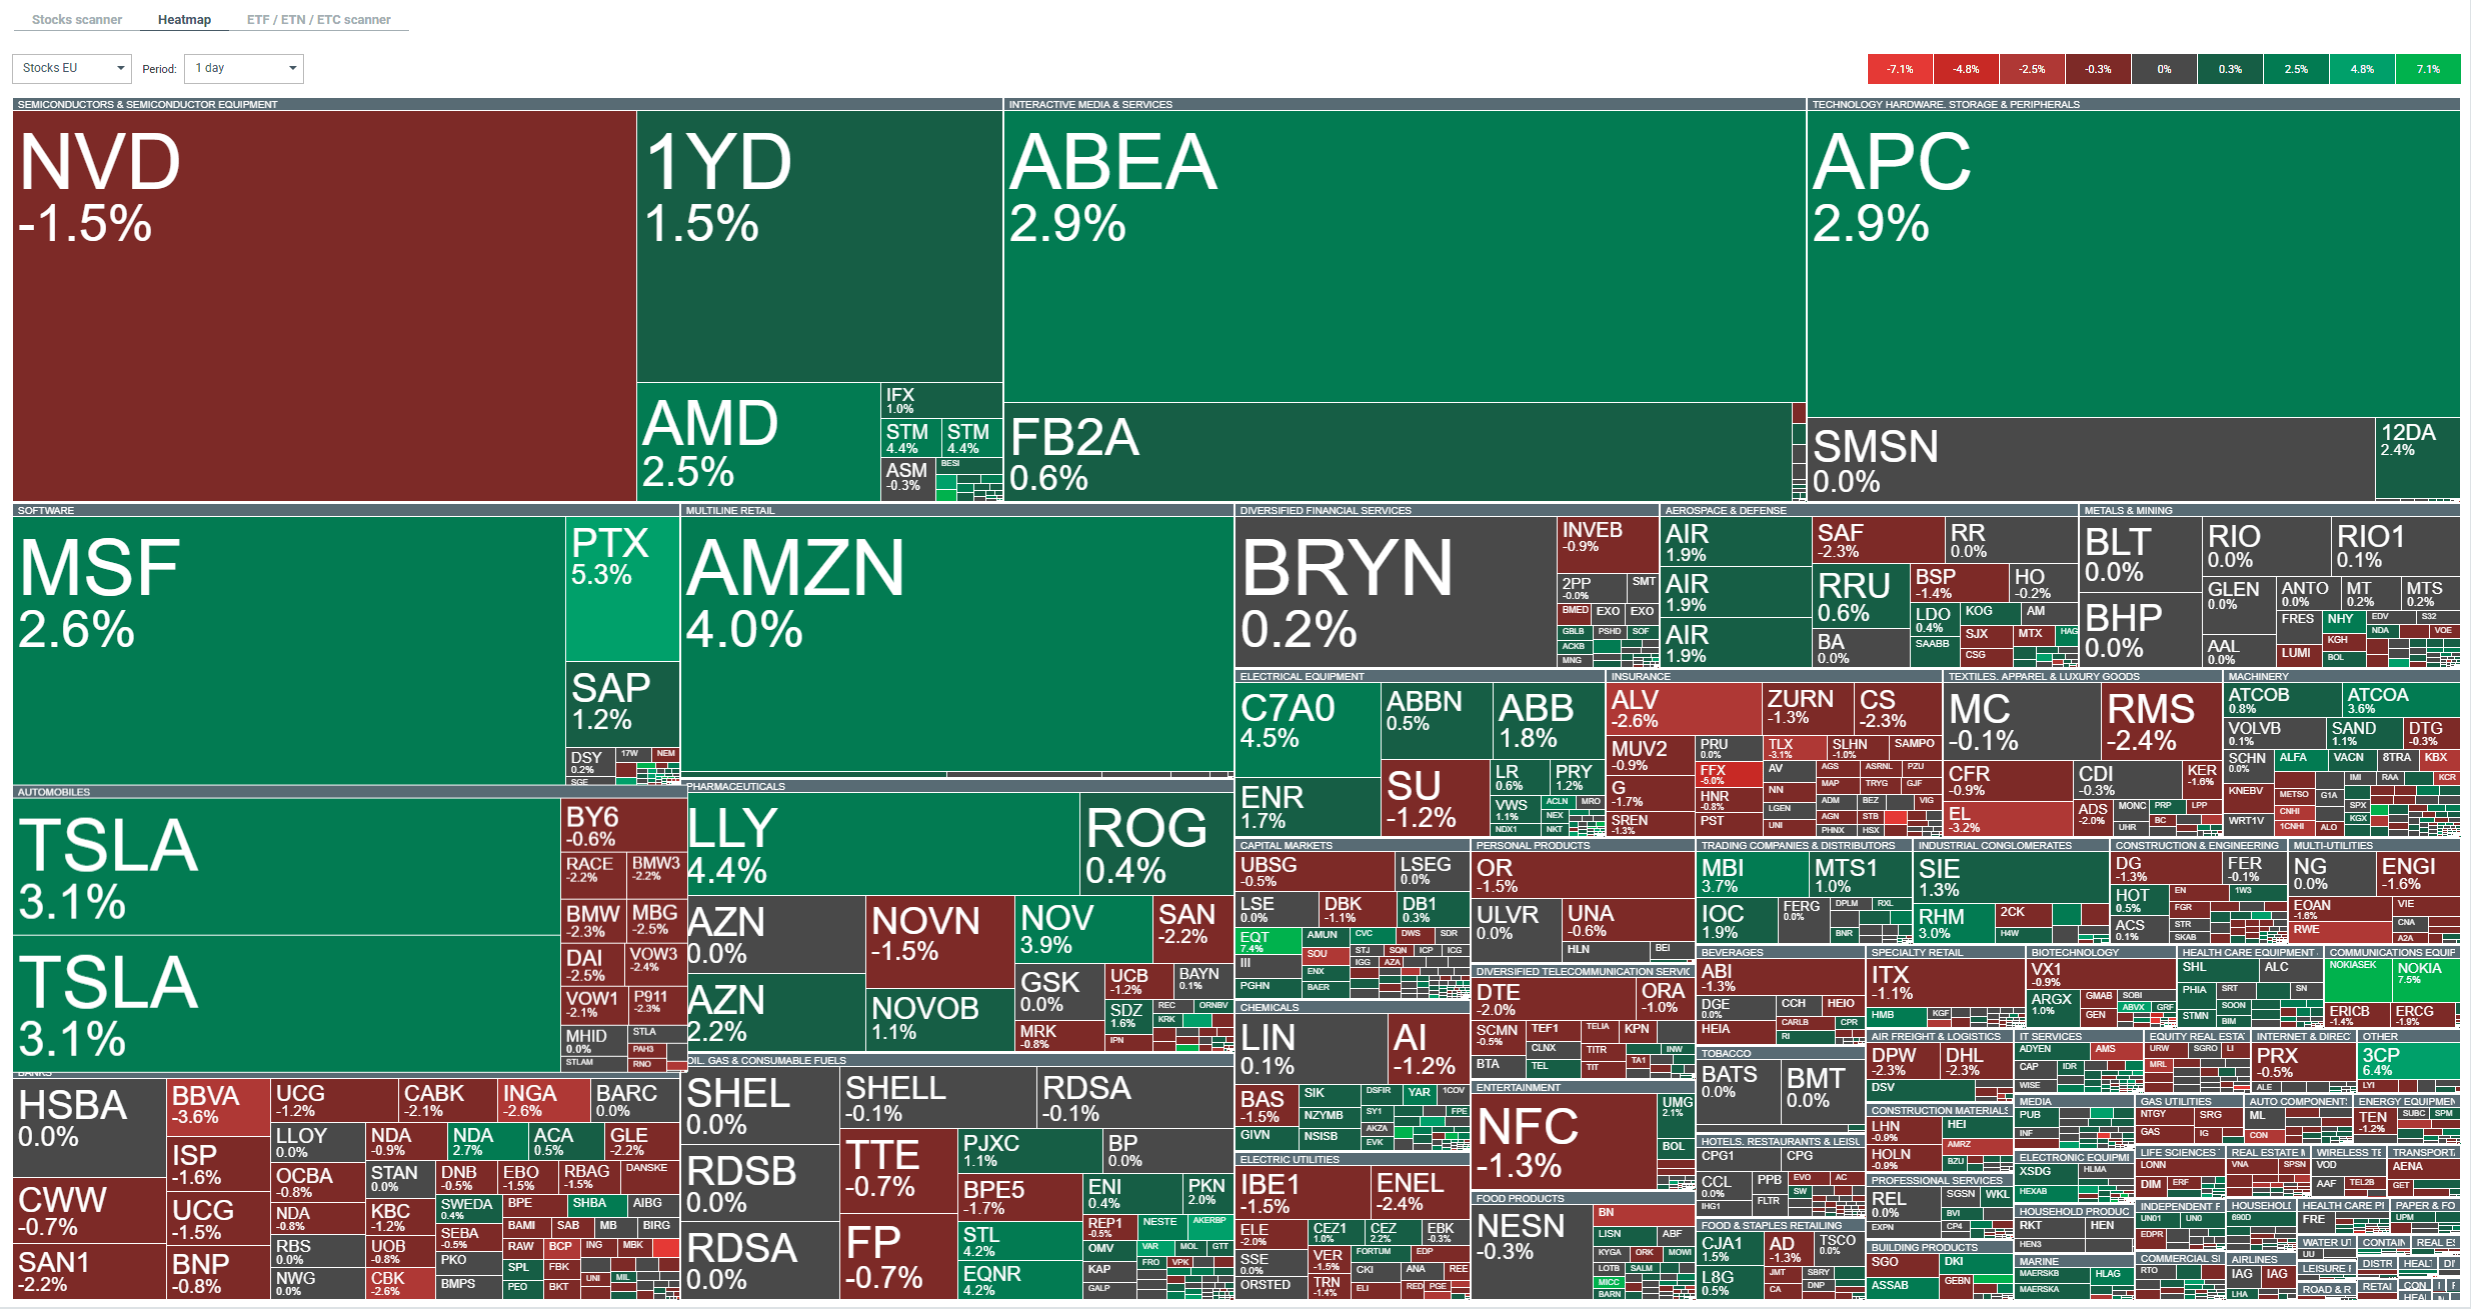
Source: xStation Company information:
- Automotive sector under pressure from tariffs — BMW and Mercedes are down by around 2%, Volkswagen is down 1.7%, and Porsche is down around 0.9%. The hardest hit, however, is parts manufacturer Continental, whose share price is down by over 4.4% — analysts emphasise that European car brands are already under double pressure: technological pressure from Chinese competition in EVs and trade pressure from Washington.
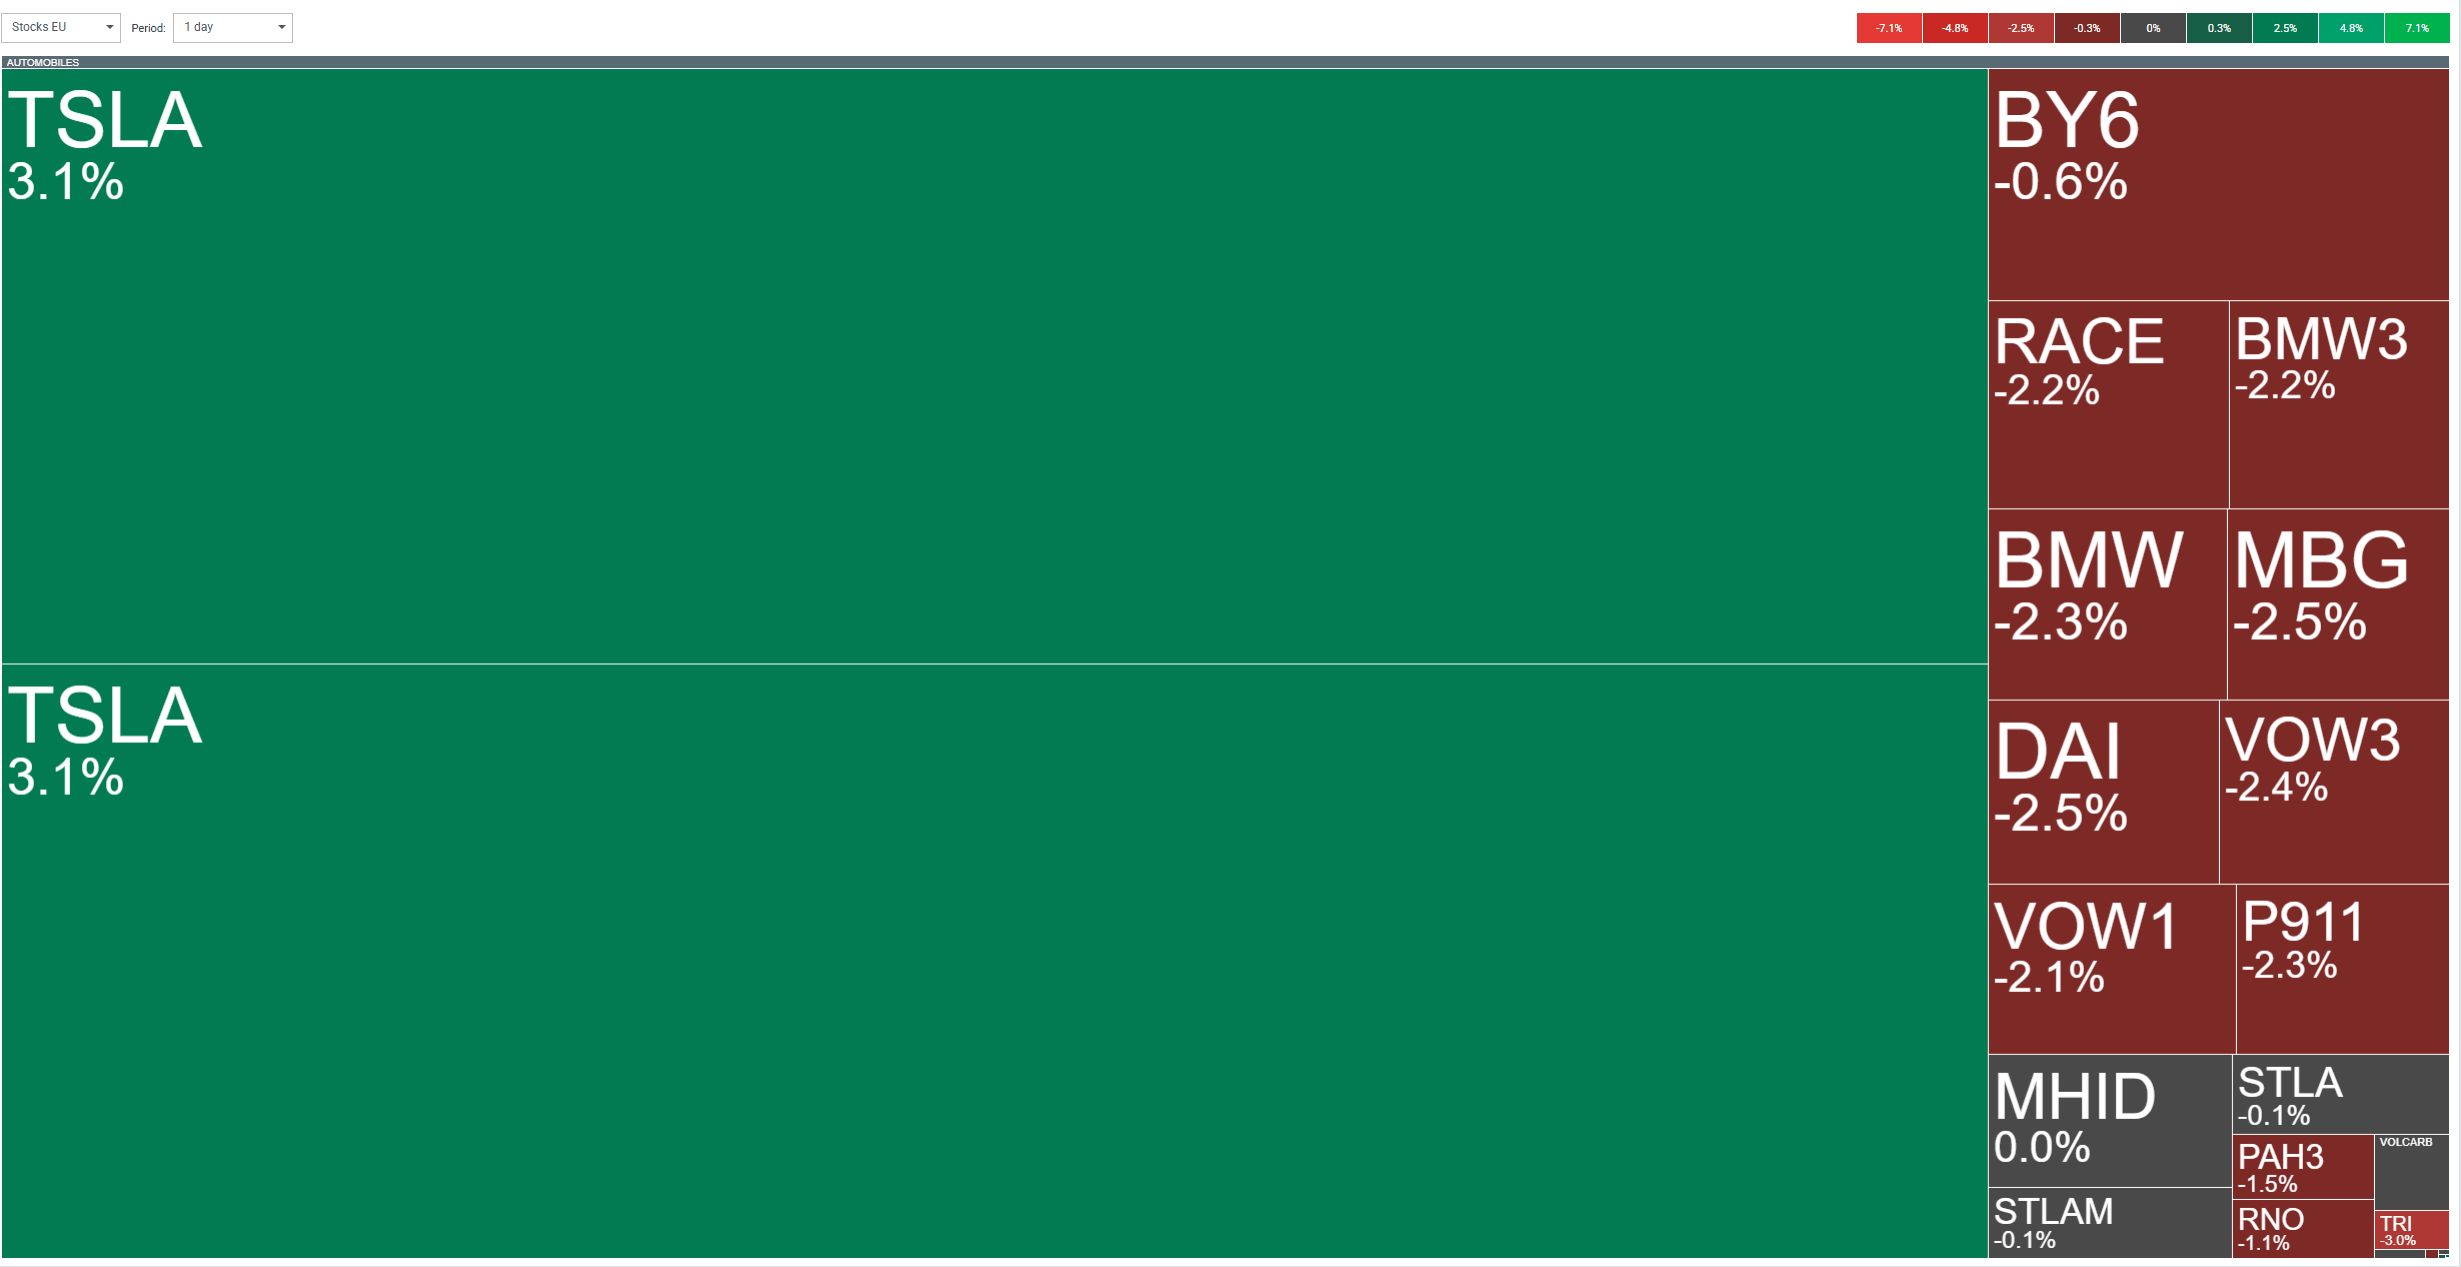
The automotive sector today. Source: xStation
- Thyssenkrupp has seen mixed trading – initially falling after announcing the suspension of sale talks with steel group Jindal Steel International, but subsequently recouping some of its losses and is now trading in positive territory. The suspension of the deal is a blow to CEO Miguel Lopez’s restructuring plans, although the company notes that spinning off the steel division remains a medium-term goal.
- Nokia is one of today’s biggest winners — shares in the Finnish telecoms giant have surged by over 6% to a 17-year high following Inseego’s announcement of its intention to acquire Nokia’s fixed wireless access division. This represents a rise of over 100% since the start of the year.
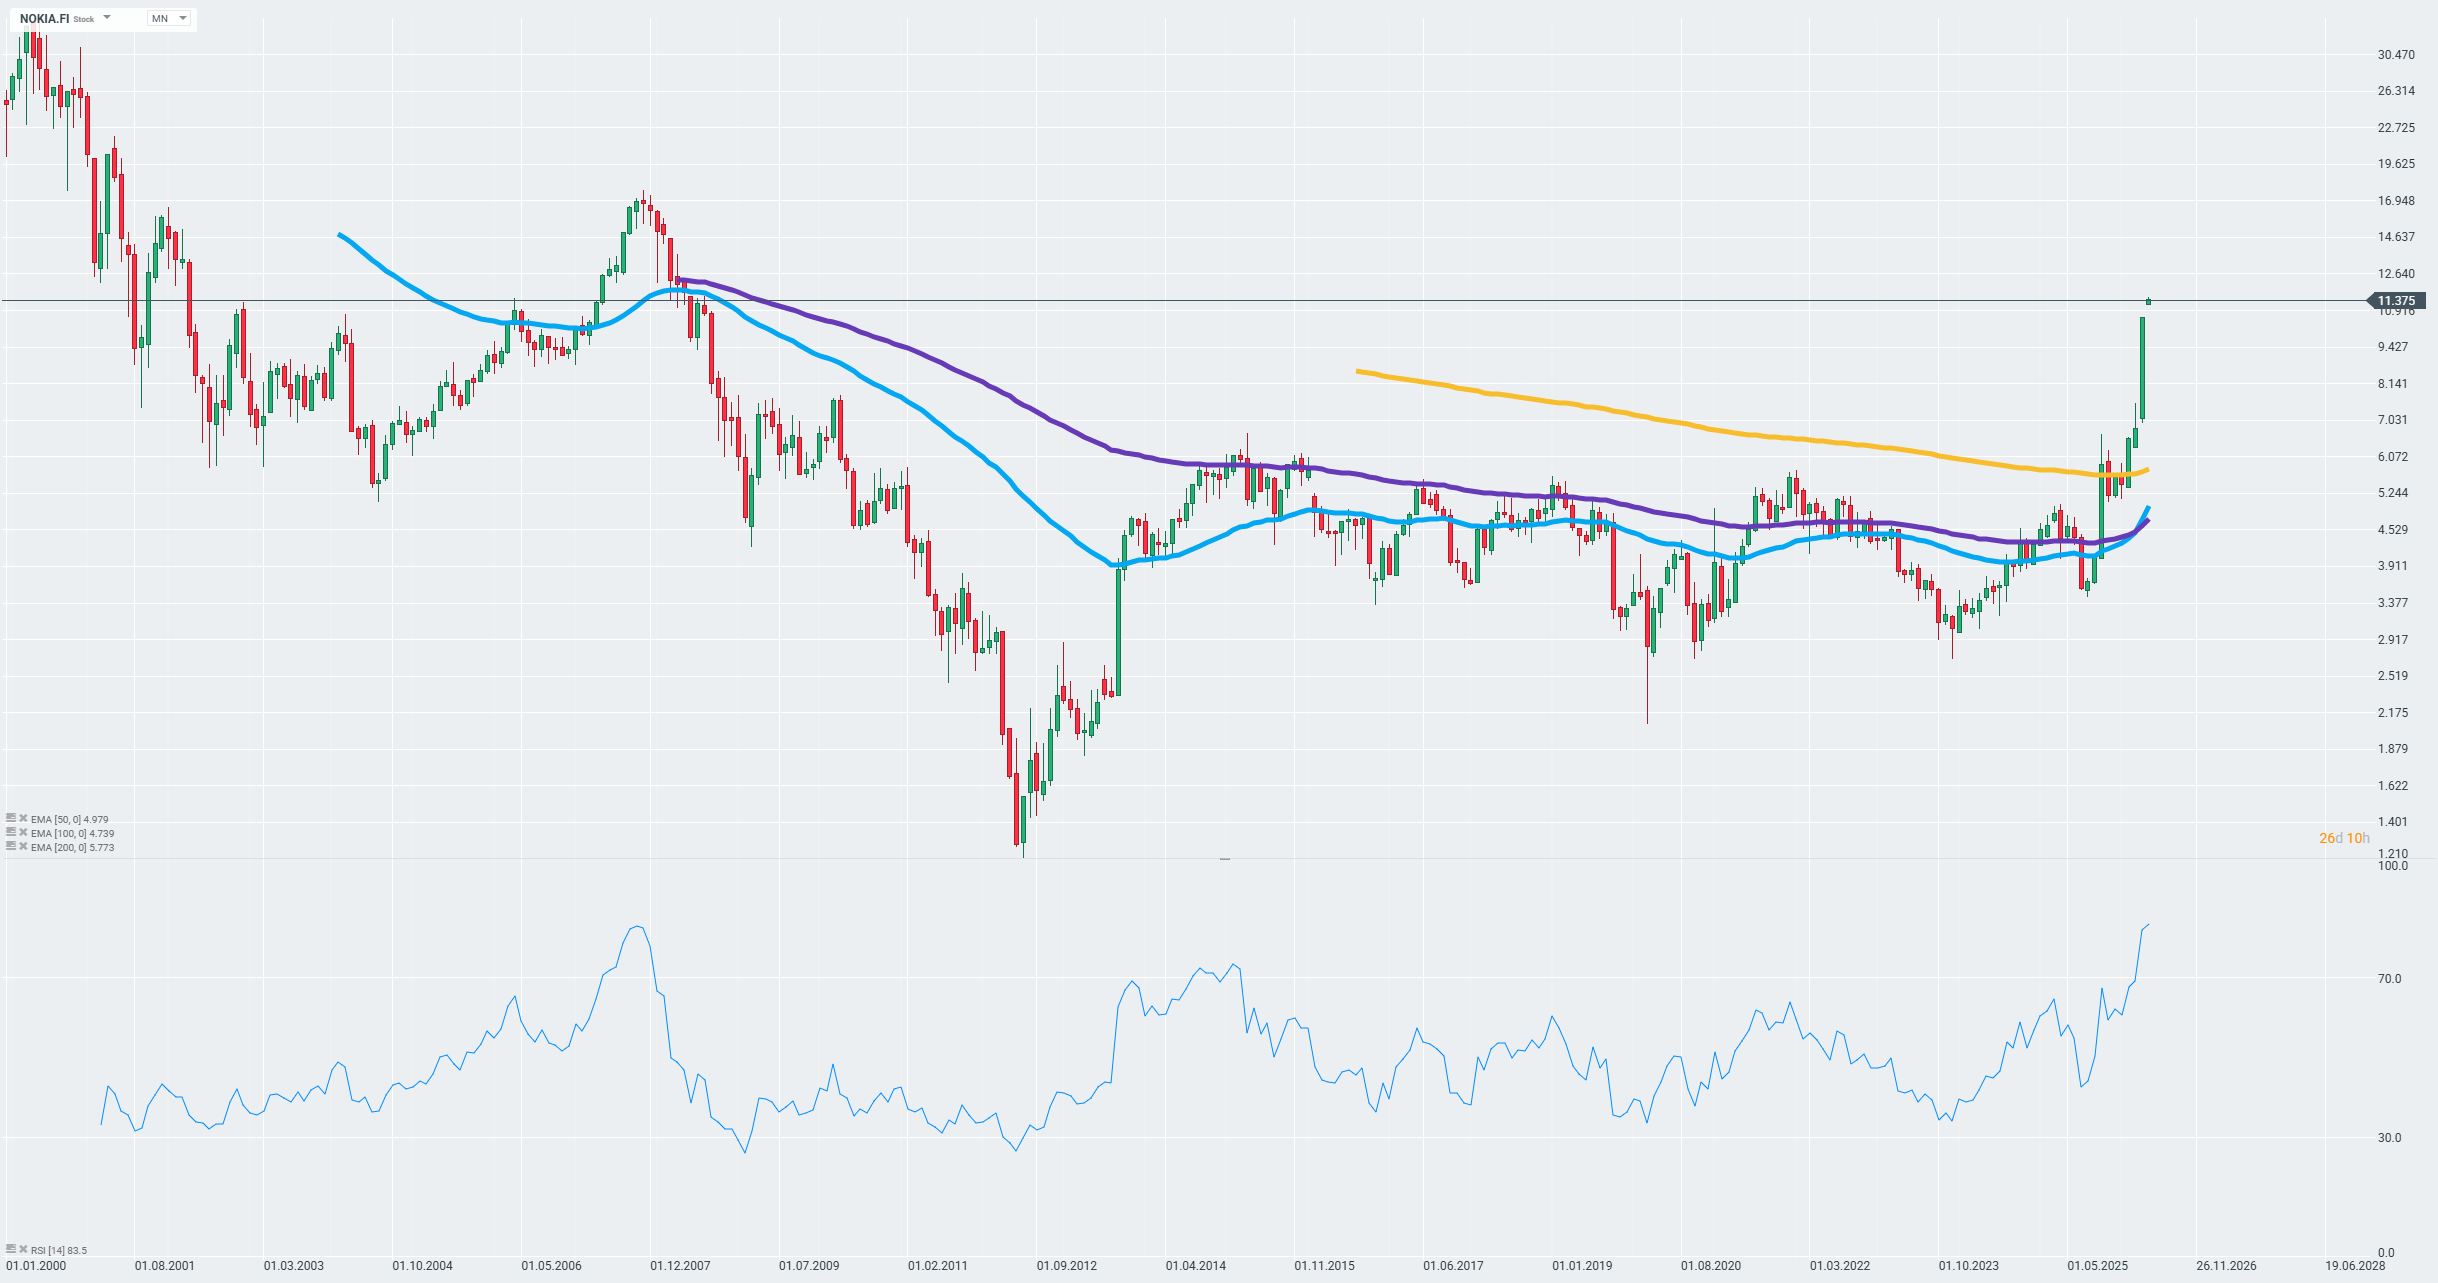
Nokia share price chart. Source: xStation
- Umicore jumps by over 13% — the Belgian materials company has surprised the market with a positive revision of its full-year EBITDA forecast, significantly boosting sentiment in its sector.