
- GBP/USD jumps to near 1.3460 as the market sentiment turns favorable for riskier assets.
- The finalization of an MoU between the US and Iran has improved the market mood.
- The Fed and BoE are scheduled to announce their monetary policies on Wednesday and Thursday, respectively.
The GBP/USD pair trades 0.35% higher to near 1.3460 during the late Asian trading session on Monday. The Cable extends its week-long advance as market sentiment improves further, following the announcement that the United States (US) and Iran have reached a deal.
At press time, S&P 500 futures are up over 1% and Asian stock markets are exhibiting a broad rally, reflecting a strong risk appetite of investors. The US Dollar Index (DXY), which tracks the Greenback’s value against six major currencies, trades 0.4% lower at near 99.40.
Pakistan Prime Minister (PM) Shehbaz Sharif has stated in a post on X, formerly known as Twitter, that the finalized memorandum of understanding (MoU) between the US and Iran will be signed on June 19 in Switzerland.
Meanwhile, investors brace for a volatile week, especially for the British Pound (GBP), as an array of United Kingdom (UK) data, including the labor market report for three months ending in April and the Consumer Price Index (CPI) data for May, along with the Bank of England’s (BoE) monetary policy announcement, will be key events to watch out.
In the US, investors will focus on the Federal Reserve’s (Fed) monetary policy, which will be announced on Wednesday.
GBP/USD technical analysis
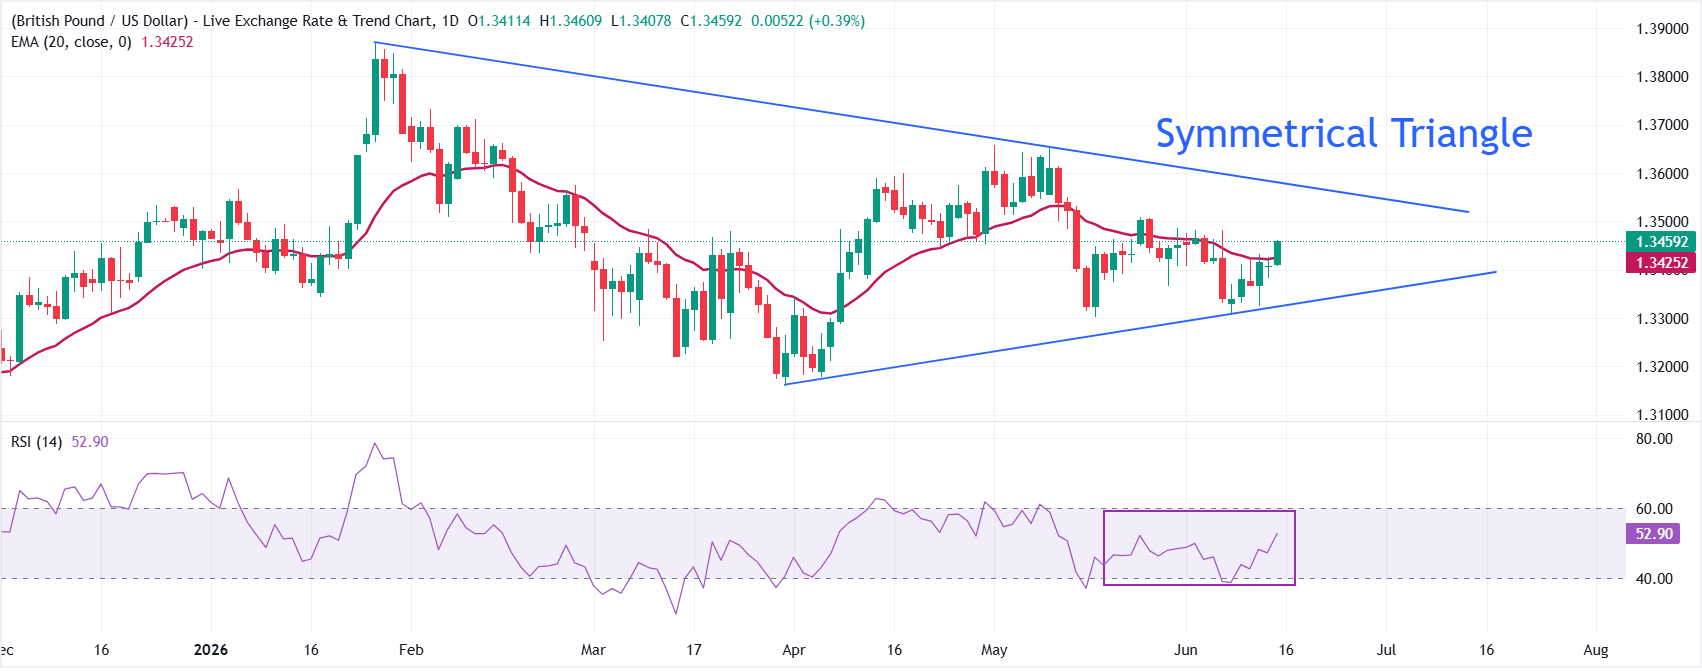
GBP/USD trades sharply higher at around 1.3460 as of writing. The near-term bias has turned mildly bullish as it returns above the 20-period exponential moving average (EMA), which is at 1.3425.
The Relative Strength Index (RSI) at about 53 hovers just above the midline, hinting at steady, rather than aggressive, upside momentum while the pair consolidates within this supported backdrop.
On the topside, the primary hurdle is the May 26 high at around 1.3500, followed by the descending resistance trend line, with its break price near 1.3580. On the downside, initial demand would be seen around the 20-EMA at 1.3425, while the upward trend-line support around 1.3327 would remain a key support zone.