Gold steadies after hitting two-and-a-half-month low, hawkish Fed outlook caps gains

- Gold stages a rebound on Monday but remains near 11-week lows.
- Higher-for-longer interest rate expectations continue to weigh on non-yielding Gold.
- XAU/USD remains below its key moving averages, keeping the near-term technical outlook bearish.
Gold (XAU/USD) recovers some ground on Monday after sliding to its lowest level since March, as traders assess fresh geopolitical developments in the Middle East. However, hawkish Federal Reserve (Fed) expectations continue to cap the upside.
At the time of writing, XAU/USD is trading around $4,330 after hitting an intraday low of $4,268, a level last seen on March 23.
Iran and Israel exchanged fire over the weekend for the first time since the ceasefire announced in April. The renewed hostilities have dimmed hopes for a near-term peace deal in the Middle East.
US President Donald Trump tried to calm the situation, posting on Truth Social that, “Both sides, Israel and Iran, are looking to do an immediate CEASEFIRE! Final negotiations on ‘Peace’ are proceeding.”
Trump also warned that the US naval blockade of Iranian ports would remain “in full force and effect” until a final agreement is reached.
Meanwhile, Iran’s armed forces announced the end of military operations against Israel, according to Fars News Agency, and said it would respond more forcefully to any future Israeli attacks on Lebanon.
Following the developments, the US Dollar Index (DXY) reversed earlier gains, offering some relief to Dollar-denominated Gold. At the time of writing, the DXY, which tracks the Greenback’s value against a basket of six major currencies, is trading around 99.94 after earlier touching 100.21, its highest level since early April.
Markets remain concerned about the economic fallout from the war, as higher Crude Oil prices have heightened inflation risks and increased the likelihood of interest rate hikes by major central banks, particularly the Fed.
On top of that, resilient US economic data, including the stronger-than-expected Nonfarm Payrolls (NFP) report released on Friday, further reinforced expectations that the US central bank can keep borrowing costs higher for longer.
According to the CME FedWatch Tool, traders now see a 38% chance of a 25-basis-point (bps) rate hike at the September meeting, up from 22% a week ago.
Gold is often seen as a hedge against inflation and geopolitical uncertainty. However, higher interest rates can weigh on demand because the precious metal offers no yield.
Looking ahead, traders will watch US inflation figures due later this week while keeping a close eye on the situation in the Middle East.
Technical analysis: XAU/USD stays bearish as RSI nears oversold territory
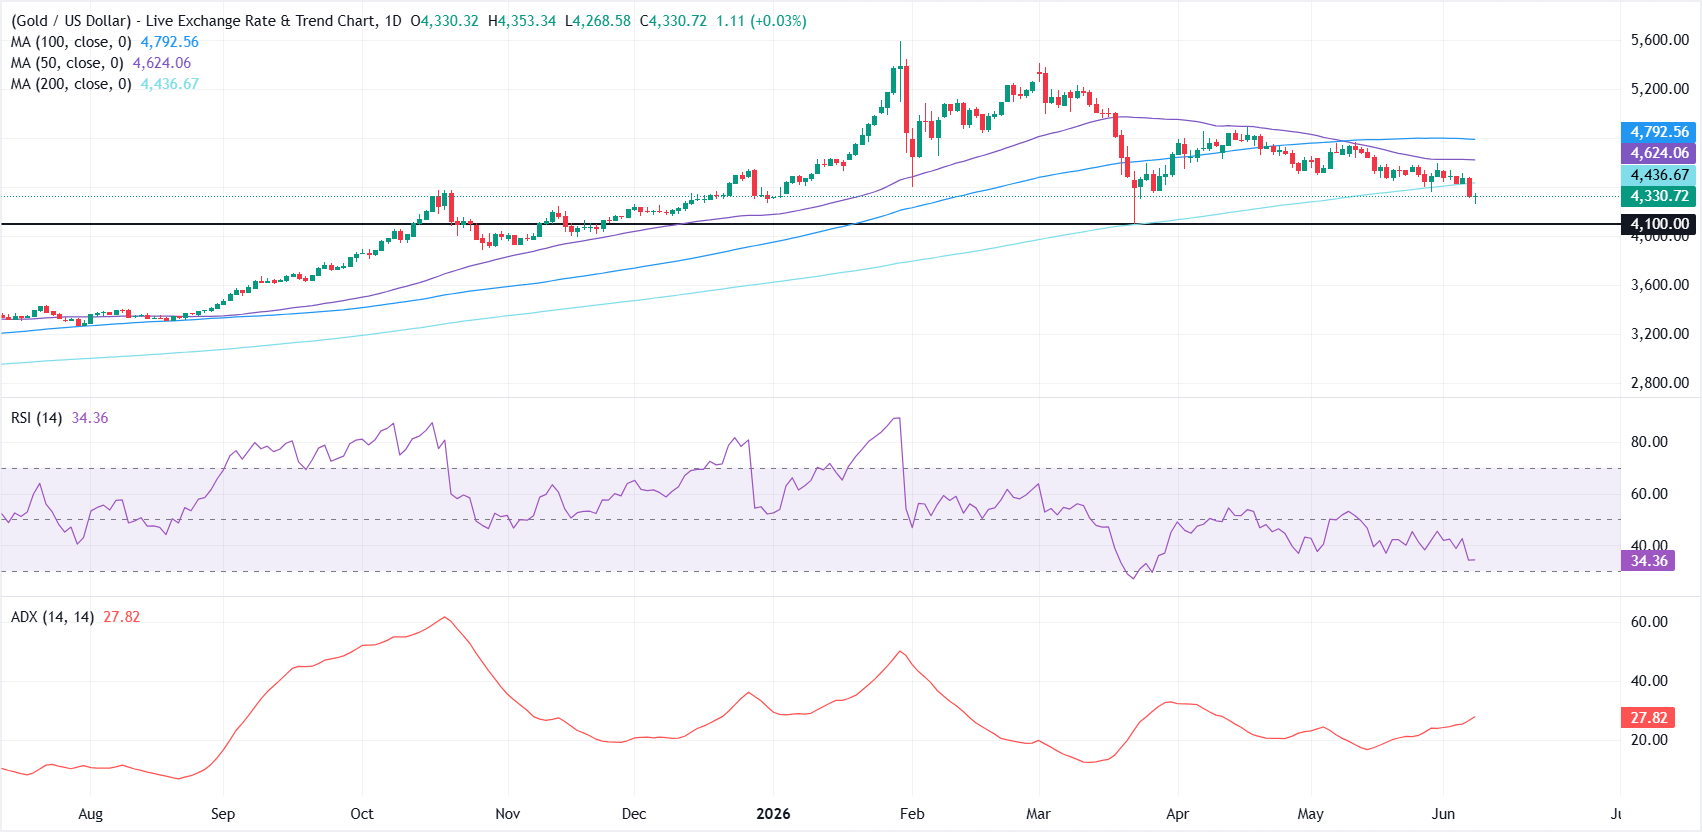
On the daily chart, XAU/USD maintains a bearish near-term tone as spot holds beneath the major moving averages. The Relative Strength Index (RSI) sits near 34, showing weak momentum edging toward oversold conditions, while the Average Directional Index around 28 suggests a moderately developed downtrend rather than a volatile selloff.
On the topside, initial resistance is seen at the 200-day Simple Moving Average (SMA) near $4,436, and a daily close above this area would be needed to ease immediate selling pressure. If buyers manage to extend a recovery, the next hurdles emerge at the 50-day SMA around $4,624 and then the 100-day SMA close to $4,793, where the medium-term bearish structure would likely be challenged.
On the downside, the next notable cushion sits at the horizontal support zone near $4,100, where a break would open the way to deeper losses.